Pivot Highs&lows: Short/Medium/Long-term + Spikeyness Filter
A fractal-based pivot analysis tool that identifies and grades pivot highs and lows across short, medium, and long-term timeframes to help traders understand market structure.
Explore 11,183 indicators. Filter beyond the obvious.
Discover the tools that fit the way you trade.
11,183 tools to explore
A fractal-based pivot analysis tool that identifies and grades pivot highs and lows across short, medium, and long-term timeframes to help traders understand market structure.
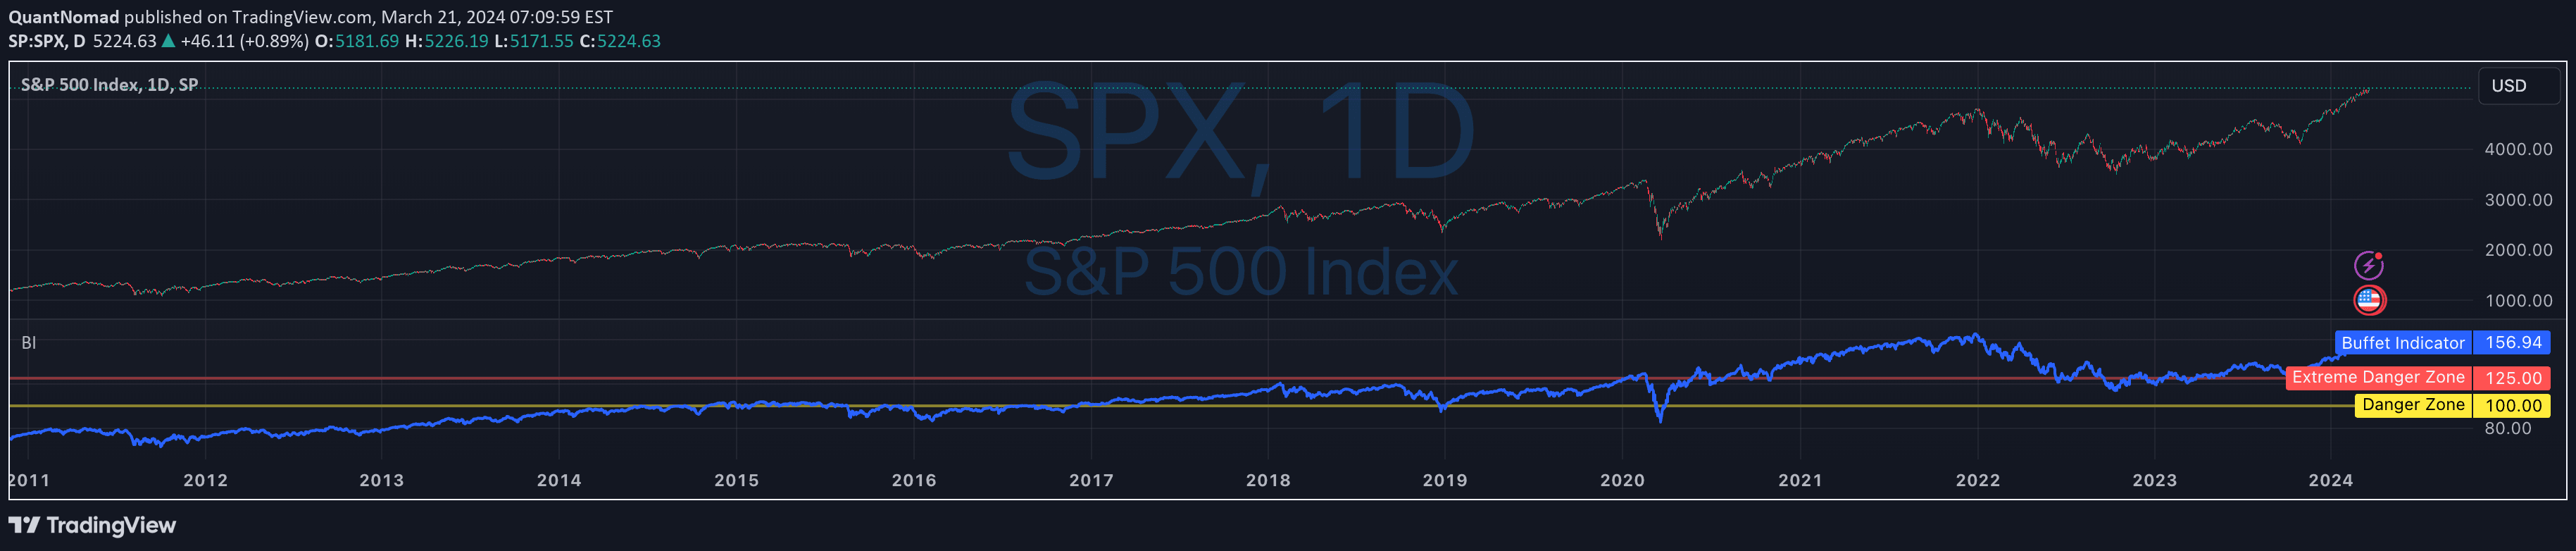
A market valuation indicator comparing total stock market capitalization to US GDP, providing insight into potential market overvaluation or undervaluation.
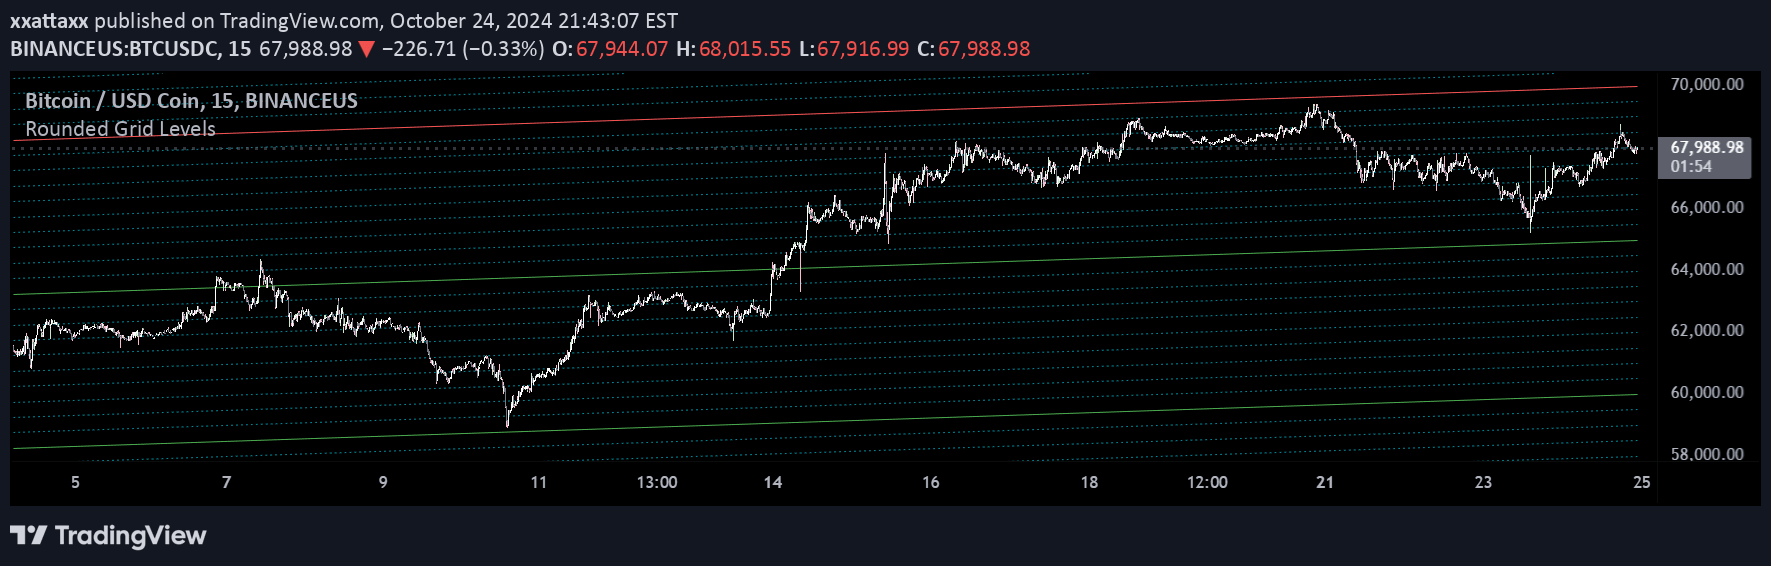
A visual tool that dynamically highlights key psychological round number price levels on charts, helping traders identify potential support, resistance, and market sentiment zones.
A forex-focused indicator that plots multiple rounded price levels including big figures, mid-figures, and institutional levels to help traders identify potential support and resistance zones.
A technical analysis tool for the S&P 500 that uses moving averages, price changes, and market breadth to generate normalized trading signals.
An investment valuation method comparing a company's total assets to its market capitalization to determine whether a security is overvalued or undervalued.
A comprehensive trading dashboard that combines multiple technical indicators to provide a quick overview of market conditions, helping traders assess trend direction and potential trading opportunities.
An ICT daily bias indicator that assesses market direction by analyzing price action relative to the previous two days' highs and lows.
A comprehensive financial analysis radar chart that evaluates multiple key performance indicators to assess a company's financial health and investment potential.
Century Levels Indicator automatically identifies key price levels for support and resistance, dynamically adjusting lines based on current market price to enhance trading strategy.
A trading indicator that helps traders identify and draw daily, weekly, and monthly price levels for potential trading opportunities across different time frames.
Buffett Ratio tracks the total US stock market capitalization relative to GDP, providing a broad market valuation metric to assess potential over or undervaluation of equities.
Likes, views, and comments are historical TradingView snapshots. They describe attention, not trading performance.