RSI Divergence Screener by zdmre
An RSI Divergence Scanner that tracks bullish and bearish signals across multiple assets, identifying potential trend reversals by comparing price action to RSI momentum.
Explore 11,183 indicators. Filter beyond the obvious.
Discover the tools that fit the way you trade.
11,183 tools to explore
An RSI Divergence Scanner that tracks bullish and bearish signals across multiple assets, identifying potential trend reversals by comparing price action to RSI momentum.
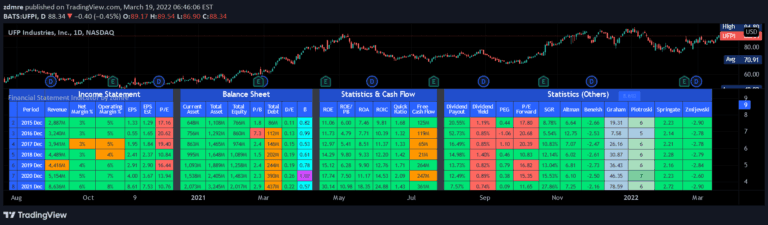
A comprehensive financial analysis tool that combines key financial statement metrics to assess a company's financial health, performance, and investment potential across income, balance sheet, and cash flow dimensions.
A trading signal using standard deviation to analyze price volatility and identify potential trend reversals by measuring price fluctuations over a specified time frame.
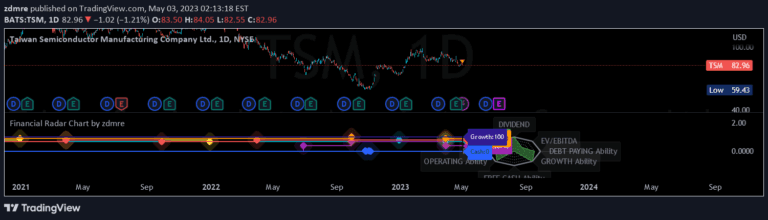
A comprehensive financial analysis radar chart that evaluates multiple key performance indicators to assess a company's financial health and investment potential.
The IOFin F-Score evaluates a company's financial strength by assessing ten key criteria. It provides a discrete score between zero and ten to help investors identify strong value stocks.
An advanced market analysis indicator combining weighted moving average and Fibonacci bands to help traders identify trend dynamics, support/resistance levels, and potential market indecision points.
Likes, views, and comments are historical TradingView snapshots. They describe attention, not trading performance.