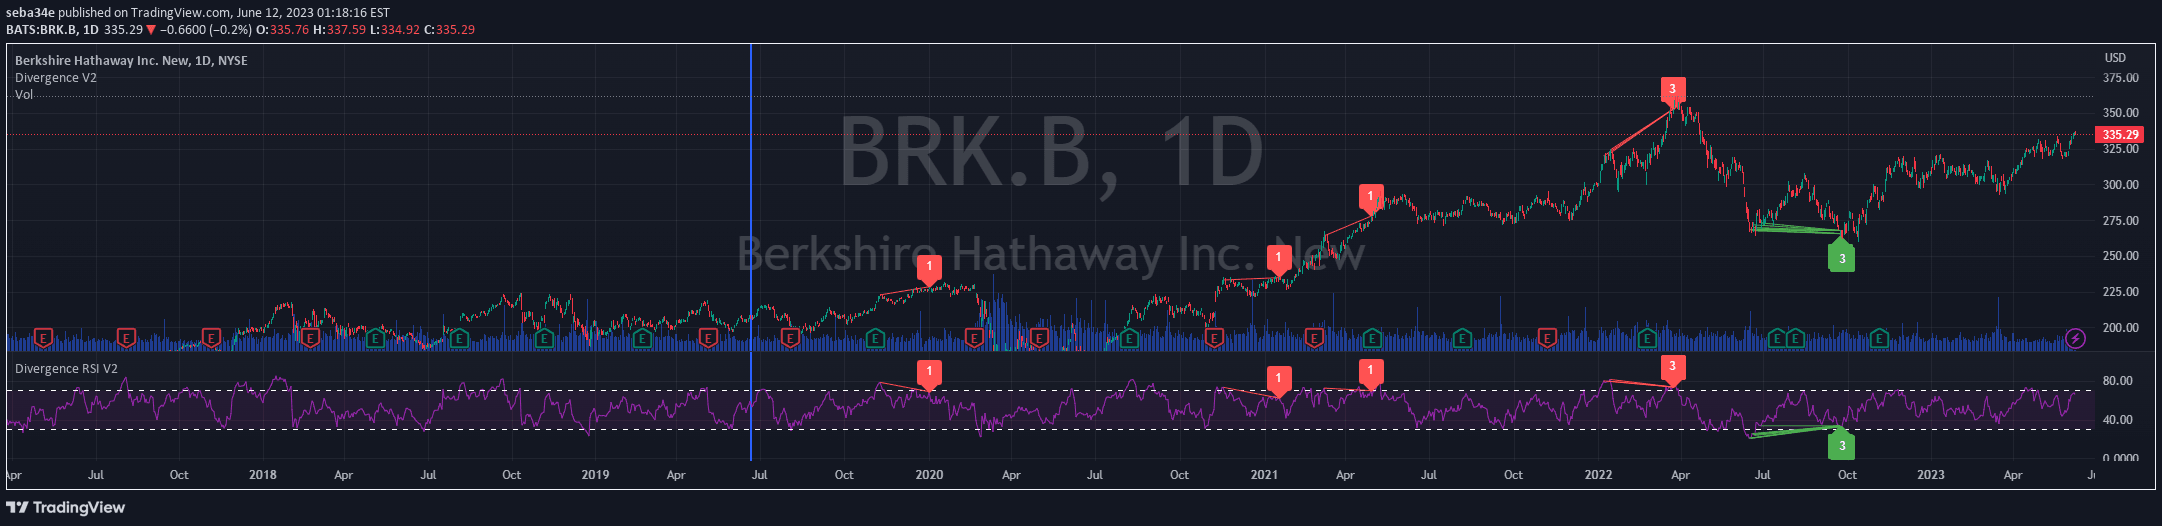
An RSI Divergence Scanner that tracks bullish and bearish signals across multiple assets, identifying potential trend reversals by comparing price action to RSI momentum.
Explore complementary indicator rolesHow it works
The RSI Divergence Scanner analyzes the Relative Strength Index (RSI) to detect potential trend reversals by comparing price movements with RSI momentum. When price makes a new high or low that isn't confirmed by the RSI, it signals a potential divergence, which could indicate weakening trend momentum.
The scanner tracks these divergences across multiple assets, providing a systematic way to identify moments when price and momentum are out of sync. By calculating the number of days since the last bullish or bearish divergence, traders can quickly assess the recent signal status for each tracked asset.
Why it may be useful
RSI Divergence is a powerful technical analysis tool that helps traders identify potential trend reversals before they become obvious in price action. By revealing discrepancies between price movement and momentum, it provides early warning signals that can help traders anticipate potential trend changes.
This scanner's ability to track multiple assets simultaneously offers traders a comprehensive view of market dynamics, enabling more informed decision-making across different trading instruments. It transforms complex technical analysis into an easily digestible format, making sophisticated trading insights more accessible.
When to explore it
The RSI Divergence Scanner is most effective in markets with clear trending behavior, where momentum and price movements show significant correlation. Traders should use this tool when looking to identify potential trend exhaustion or reversal points across different timeframes and assets.
It works particularly well in volatile markets like cryptocurrencies, forex, and actively traded stocks, where rapid momentum shifts can signal important trading opportunities. Traders should combine this scanner with other technical and fundamental analysis tools to confirm signals and manage risk effectively.
Keep exploring
What we’ve verified
Access, alerts and repainting behaviour have not been independently verified for this indicator. Check the creator’s current publication and settings.
General descriptions and classifications are recovered research. Verified details above identify the specific checks we have completed. Check the creator’s current publication for later changes.