
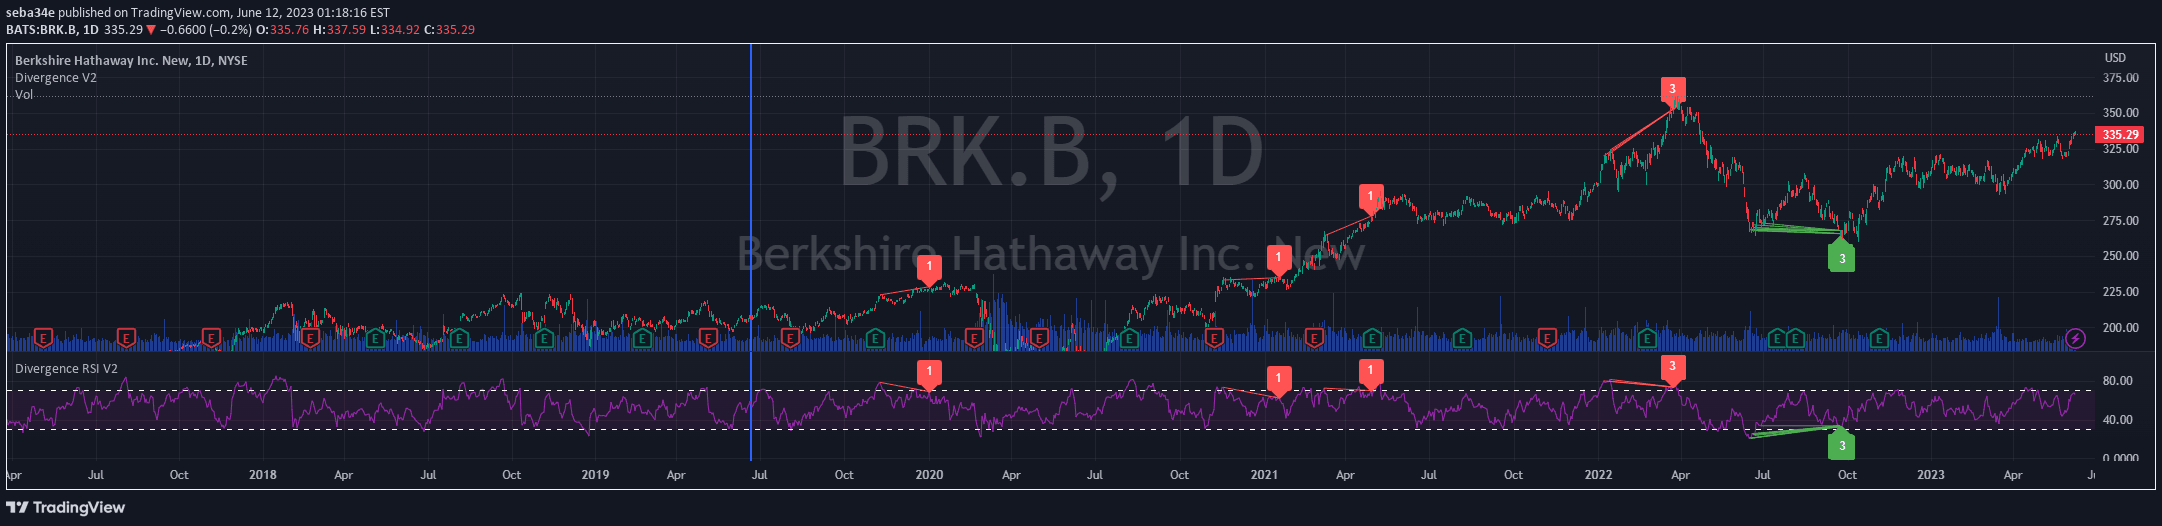
A technical indicator that identifies divergences between asset price and RSI, revealing potential trend reversals by comparing price highs/lows with corresponding RSI oscillator movements.
Explore complementary indicator rolesHow it works
The RSI Divergence indicator analyzes the relationship between price action and the Relative Strength Index (RSI) oscillator by identifying discrepancies between price movements and RSI trends. It searches for specific patterns where price highs and lows do not align with corresponding RSI highs and lows, which can signal potential trend reversals.
When a divergence is detected, the indicator draws lines connecting the divergent points and color-codes them based on the type of divergence. Green lines represent bullish divergences, suggesting potential upward price movement, while red lines indicate bearish divergences, signaling potential downward price trends.
Why it may be useful
Divergence analysis provides traders with an advanced warning of potential trend reversals by highlighting moments when price momentum differs from actual price movement. This can help traders anticipate market shifts before they become apparent through traditional price action, offering a strategic advantage in timing entry and exit points.
By combining price action with oscillator behavior, the indicator offers a more nuanced view of market dynamics. It helps traders understand underlying market sentiment and potential weakness in current trends, enabling more informed decision-making and risk management strategies.
When to explore it
The RSI Divergence indicator is most effective in markets with clear trending characteristics, where momentum and price movements can be distinctly analyzed. It works best on timeframes ranging from short-term intraday charts to longer-term swing trading perspectives, providing insights across different trading styles and asset classes.
Traders should use this indicator in conjunction with other technical analysis tools to confirm signals and reduce false positives. It is particularly useful in volatile markets where price momentum can quickly shift, offering early warning signs of potential trend reversals and helping traders make more strategic trading decisions.
Keep exploring
What we’ve verified
Access, alerts and repainting behaviour have not been independently verified for this indicator. Check the creator’s current publication and settings.
General descriptions and classifications are recovered research. Verified details above identify the specific checks we have completed. Check the creator’s current publication for later changes.


