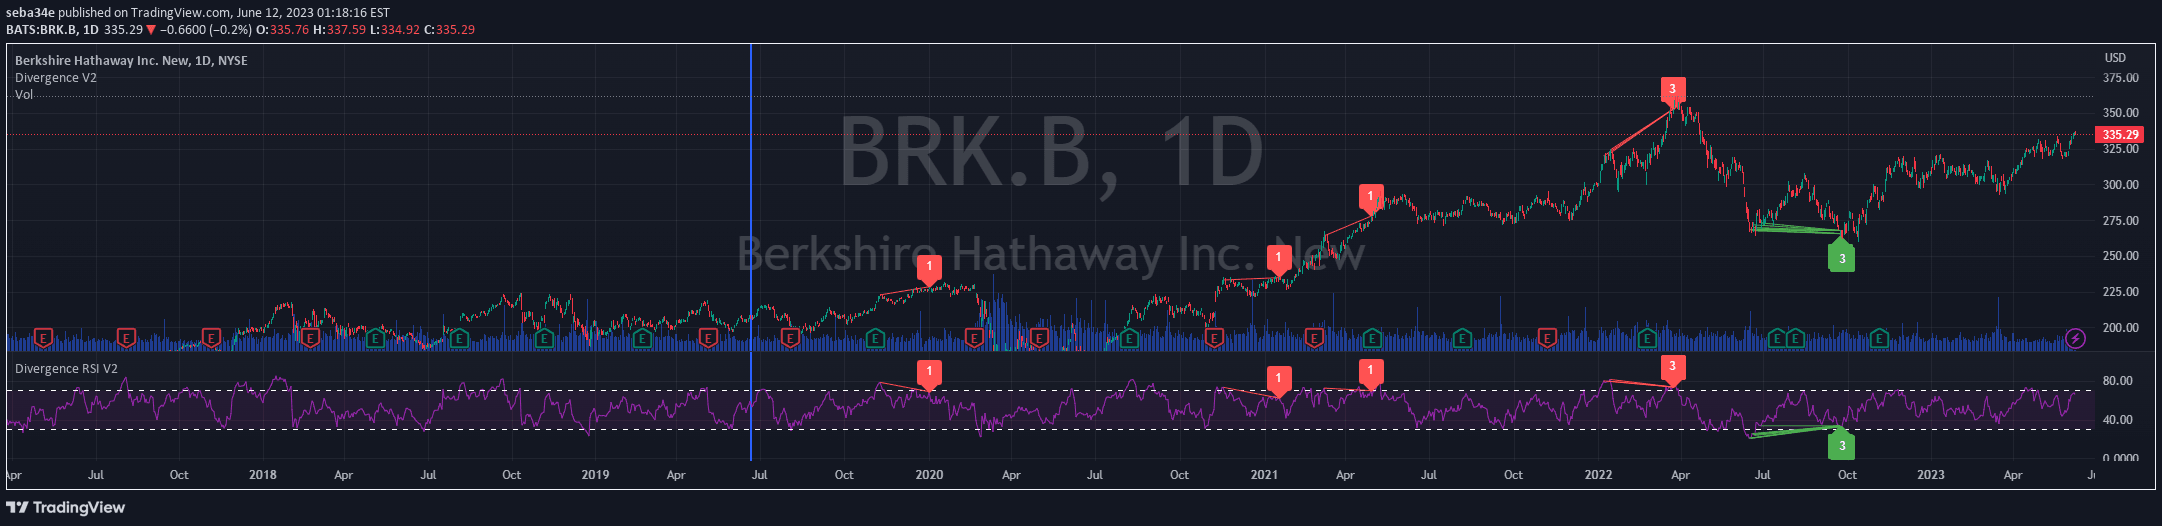
A technical indicator that identifies divergences between asset price and RSI oscillator, highlighting potential trend reversals through visual green and red divergence lines.
Explore complementary indicator rolesHow it works
The RSI Divergence indicator analyzes the relationship between price action and the Relative Strength Index (RSI) by comparing their highs and lows. It identifies points where the price and RSI oscillator show different momentum patterns, such as rising price highs with falling RSI highs or falling price lows with rising RSI lows.
When a divergence is detected, the indicator draws visual lines connecting the divergent points, color-coded as green for bullish divergences and red for bearish divergences. It also tracks and labels the number of divergence occurrences, allowing traders to quickly recognize potential trend reversal signals.
Why it may be useful
Divergence indicators are crucial for traders because they provide early warning signs of potential trend reversals before they become apparent in price action. By highlighting discrepancies between price movement and momentum, these signals help traders anticipate market turning points and make more informed trading decisions.
The visual representation of divergences makes it easier for traders to quickly identify and interpret complex market dynamics. This can be particularly valuable in volatile markets where early recognition of momentum shifts can provide a significant competitive advantage in timing entries and exits.
When to explore it
The RSI Divergence indicator works best in markets with clear trending characteristics, where momentum can be reliably measured and interpreted. It is particularly effective in identifying potential reversals in stocks, forex, and cryptocurrency markets where price and momentum often show distinct patterns.
Traders should use this indicator in conjunction with other technical analysis tools to confirm signals and reduce false positives. It is most reliable when used on higher timeframes and in markets with sufficient liquidity and trading volume.
Keep exploring
What we’ve verified
Access, alerts and repainting behaviour have not been independently verified for this indicator. Check the creator’s current publication and settings.
General descriptions and classifications are recovered research. Verified details above identify the specific checks we have completed. Check the creator’s current publication for later changes.