Divergence V2
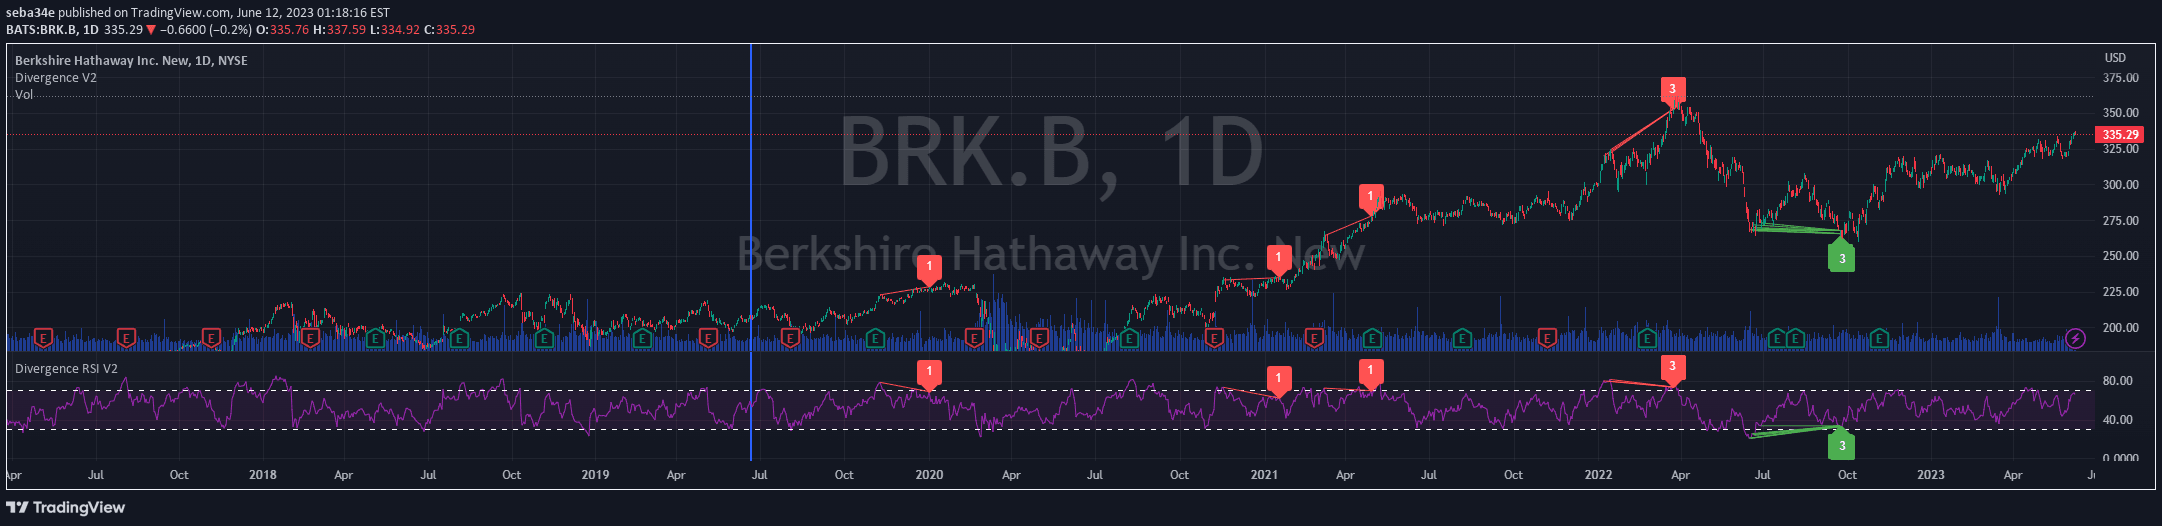
A technical indicator that identifies divergences between asset price and RSI oscillator, highlighting potential trend reversals through visual green and red divergence lines.
Explore 11,183 indicators. Filter beyond the obvious.
Discover the tools that fit the way you trade.
11,183 tools to explore
A technical indicator that identifies divergences between asset price and RSI oscillator, highlighting potential trend reversals through visual green and red divergence lines.
A trading indicator for Iron Butterfly options strategies on SPX, providing real-time breakeven point tracking and visual representation of the options strategy.
A technical indicator that identifies divergences between asset price and RSI, revealing potential trend reversals by comparing price highs/lows with corresponding RSI oscillator movements.
Likes, views, and comments are historical TradingView snapshots. They describe attention, not trading performance.