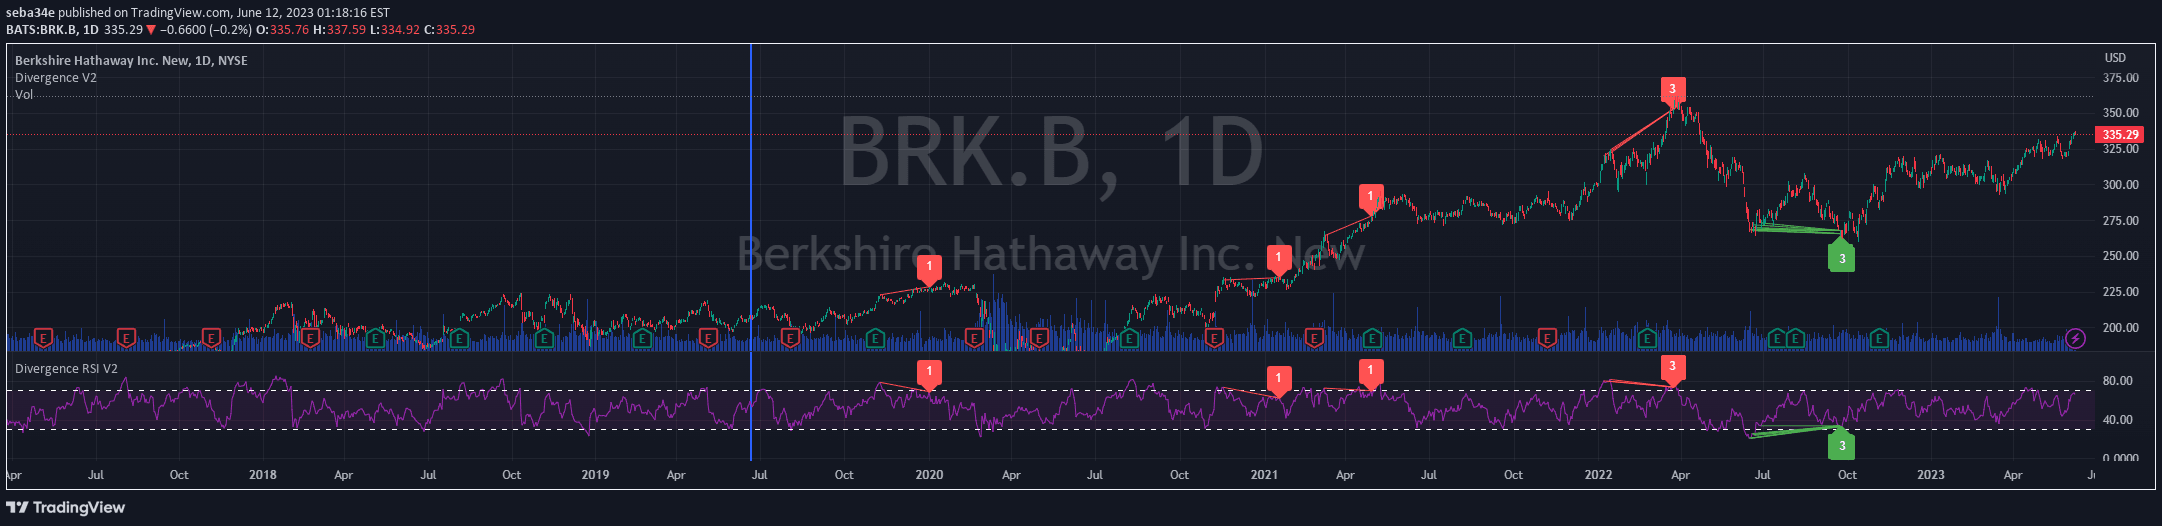
A custom RSI divergence indicator that compares fast and slow RSI lines using various smoothing techniques to identify potential market reversals and trend continuations.
Explore complementary indicator rolesHow it works
The RSI Divergence Smoothed indicator calculates two RSI lines: a fast RSI with a 5-period length and a slow RSI with a 14-period length. It applies optional smoothing techniques like WMA, HMA, SWMA, KAMA, or GMA to filter the price data before computing the RSI values.
The core functionality involves comparing these two RSI lines to detect divergences, which are then visualized on the chart. Divergences are color-coded, with white representing positive divergence and red indicating negative divergence, helping traders identify potential trend reversals or continuations.
Why it may be useful
This indicator provides traders with a nuanced view of market momentum by comparing two different RSI timeframes and applying advanced smoothing techniques. By incorporating multiple filtering methods, it offers a more refined approach to identifying potential market turning points than traditional single RSI indicators.
The multiple smoothing options allow traders to adapt the indicator to different market conditions, making it a versatile tool for analyzing price momentum. The visual representation of divergences helps traders quickly recognize potential trading opportunities and make more informed decisions about market trends.
When to explore it
The RSI Divergence Smoothed indicator is most effective in markets with clear trending or ranging conditions, where momentum shifts can signal potential trade entries or exits. Traders can use it across various timeframes, from short-term scalping to longer-term swing trading, making it a flexible analytical tool.
It is particularly useful when combined with other technical analysis tools, such as support and resistance levels, trend lines, or additional momentum indicators. Traders should pay special attention to the divergence signals, especially when they align with other confirming technical or fundamental analysis indicators.
Keep exploring
What we’ve verified
Access, alerts and repainting behaviour have not been independently verified for this indicator. Check the creator’s current publication and settings.
General descriptions and classifications are recovered research. Verified details above identify the specific checks we have completed. Check the creator’s current publication for later changes.