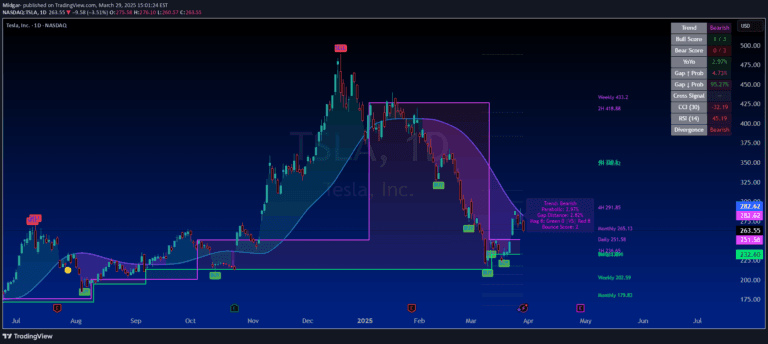
A machine learning kNN indicator that predicts price trends by analyzing historical price patterns and computing Euclidean distances to forecast potential market movements.
Explore complementary indicator rolesHow it works
The kNN Trend Predictor uses the k-Nearest Neighbors algorithm to analyze historical price data and identify similar past price patterns. By calculating Euclidean distances between current and historical price movements, the indicator finds the most closely matched historical price configurations.
Once the most similar historical patterns are identified, the algorithm generates trend predictions based on the subsequent price actions of those matched patterns. This machine learning approach allows the indicator to dynamically adapt and provide potential trend forecasts by leveraging past price behavior and statistical similarities.
Why it may be useful
The kNN Trend Predictor offers traders a sophisticated, data-driven approach to understanding potential market movements by leveraging historical price patterns. By using machine learning techniques, the indicator can uncover complex relationships in price data that might not be apparent through traditional technical analysis methods.
Traders benefit from the indicator's ability to provide color-coded trend signals and potential trade entry points, which can help improve decision-making and reduce emotional trading. The algorithmic approach provides an objective, quantitative perspective on market trends, complementing other technical and fundamental analysis tools.
When to explore it
The kNN Trend Predictor is most effective in markets with clear historical price patterns and consistent trend behaviors. It performs optimally in liquid markets with sufficient historical data, such as major forex pairs, blue-chip stocks, and widely traded commodities.
Traders should use this indicator in conjunction with other technical analysis tools to confirm signals and validate predictions. It is particularly useful for short to medium-term trading strategies, where historical price patterns can provide meaningful insights into potential future price movements.
Keep exploring
What we’ve verified
Access, alerts and repainting behaviour have not been independently verified for this indicator. Check the creator’s current publication and settings.
General descriptions and classifications are recovered research. Verified details above identify the specific checks we have completed. Check the creator’s current publication for later changes.