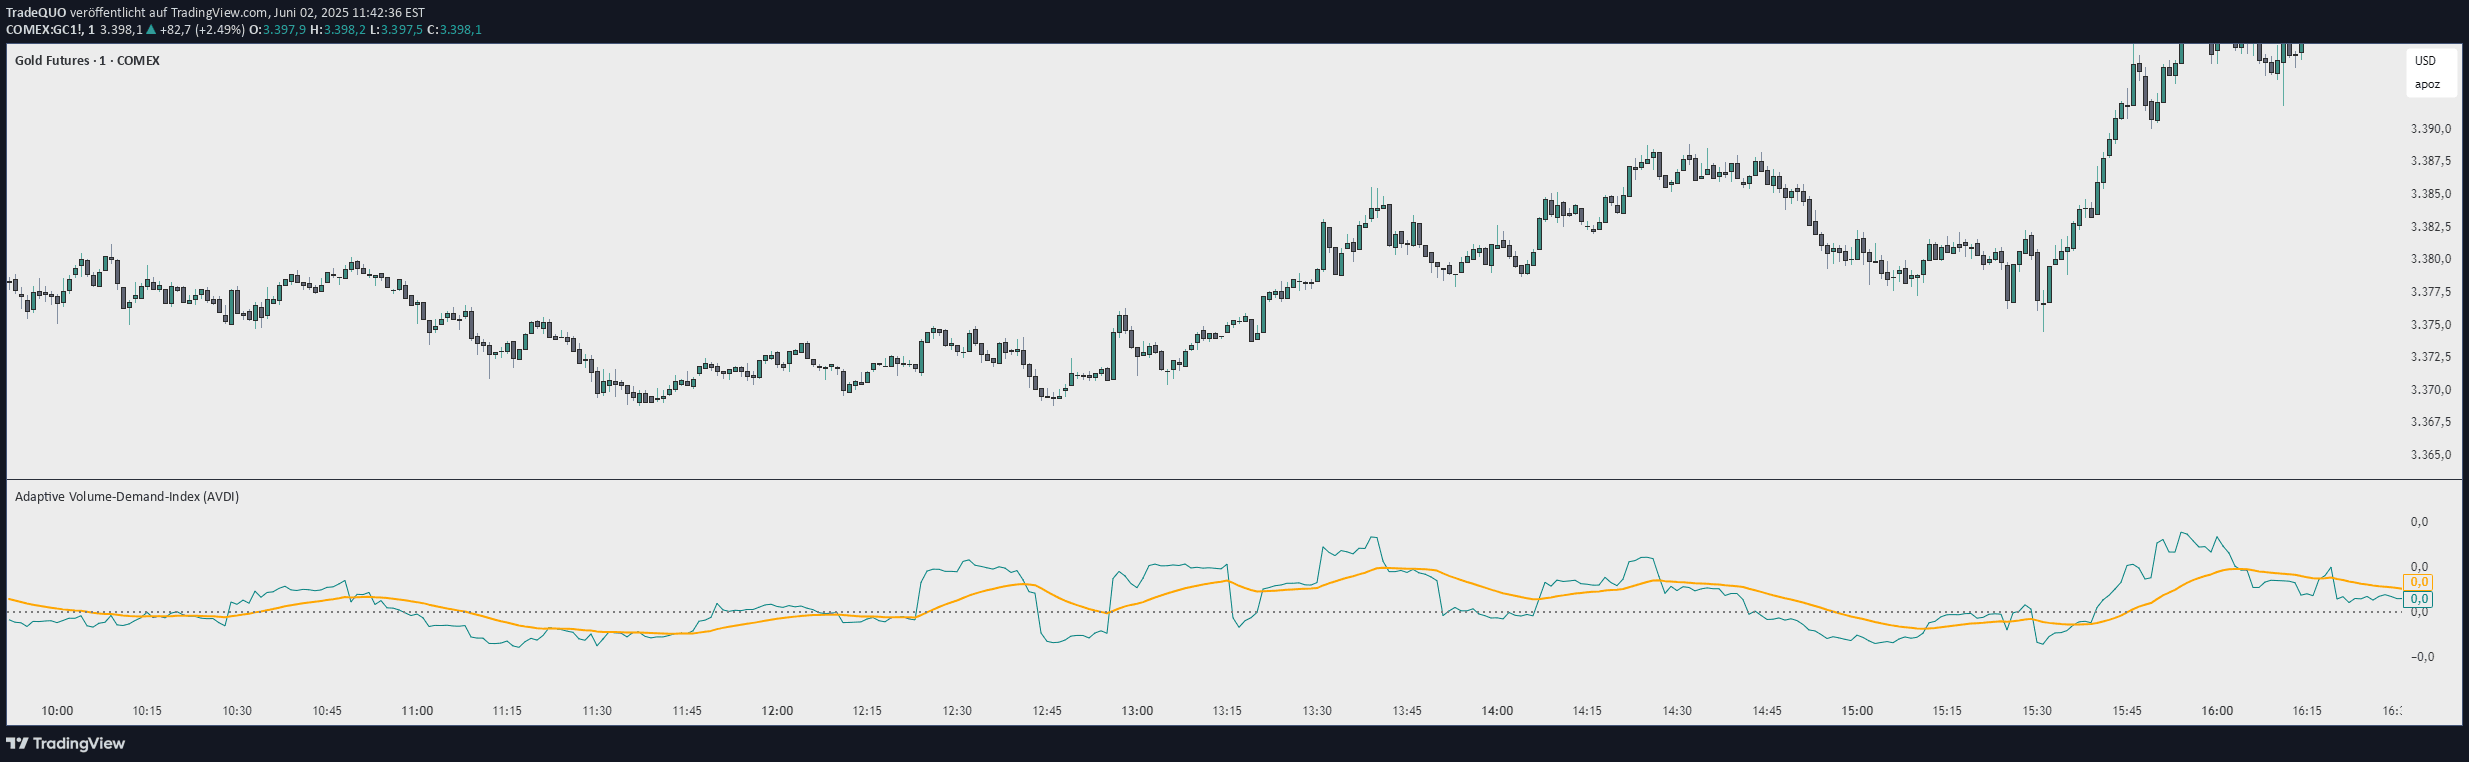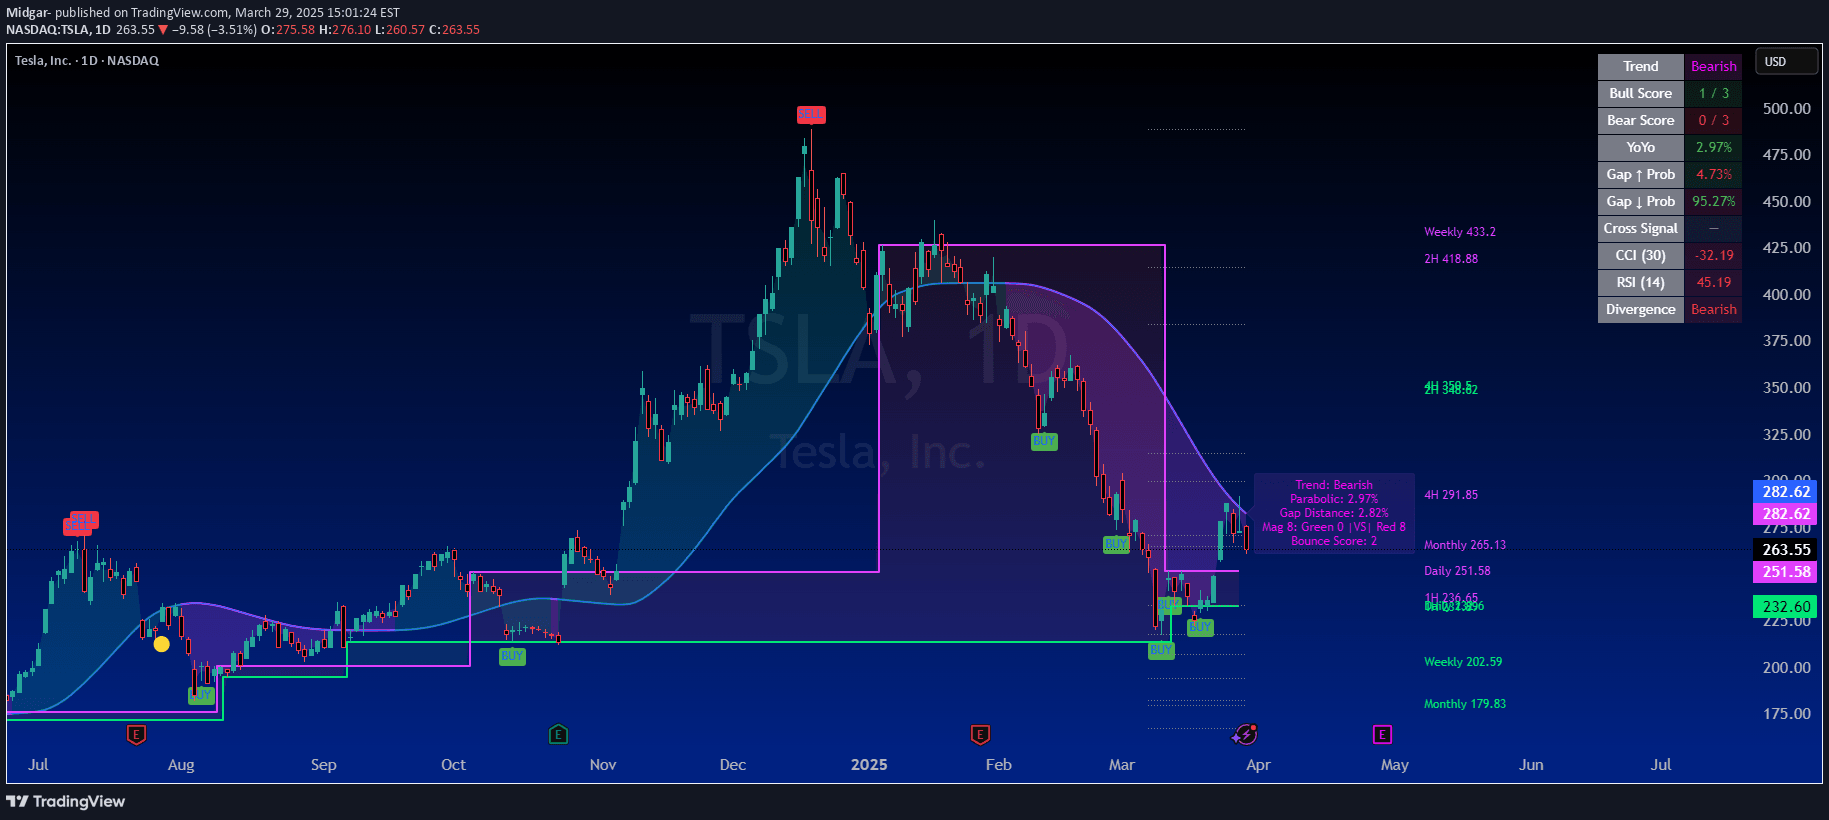
A comprehensive trading dashboard analyzing market trends using multiple indicators like RSI, EMA, and Bollinger Bands to generate buy and sell signals with multi-confirmational strategies.
Explore complementary indicator rolesHow it works
The SuperTrader script uses a 'Three Musketeers' approach, combining three distinct technical analysis methods to generate trading signals. First, it compares fast and slow exponential moving averages (EMAs) to determine trend direction, checking whether price is favoring the 50 or 200-day EMA. Second, it monitors the Relative Strength Index (RSI) for mean reversion signals, tracking when the indicator crosses typical oversold or overbought thresholds.
The third component involves Bollinger Bands, which help assess price momentum by checking whether price pushes above or below standard deviation bands. When at least two of these three conditions align in a bullish or bearish direction, the script triggers a corresponding buy or sell signal, ensuring multiple confirmations before suggesting a potential market turn.
Why it may be useful
This trading signal provides traders with a robust, multi-dimensional view of market dynamics by synthesizing different technical indicators into a unified analysis. By combining trend, momentum, and volatility indicators, it offers a more comprehensive assessment of potential market movements than single-indicator approaches. The method reduces false signal risks by requiring multiple confirmations before generating a trade recommendation.
The dashboard's additional features, such as tracking major stocks' daily performance and providing gap probability estimates, give traders broader market context. Its adaptive approach, including VIDYA trend lines and divergence checks, helps traders understand not just current market conditions but potential future price behaviors.
When to explore it
This signal works best in markets with clear trending characteristics, particularly for stocks and major indices with consistent liquidity and volatility. It is especially effective during periods of moderate market movement where multiple technical indicators can provide reliable signals. Traders should use this approach when seeking a systematic, confirmational method of identifying potential entry and exit points.
The signal is particularly useful for day and swing traders who want a comprehensive view of market conditions. It excels in markets with established trends and when trading liquid, high-volume securities. Traders should be cautious during extreme market volatility or news-driven events where traditional technical indicators might provide less reliable signals.
Keep exploring
What we’ve verified
Access, alerts and repainting behaviour have not been independently verified for this indicator. Check the creator’s current publication and settings.
General descriptions and classifications are recovered research. Verified details above identify the specific checks we have completed. Check the creator’s current publication for later changes.