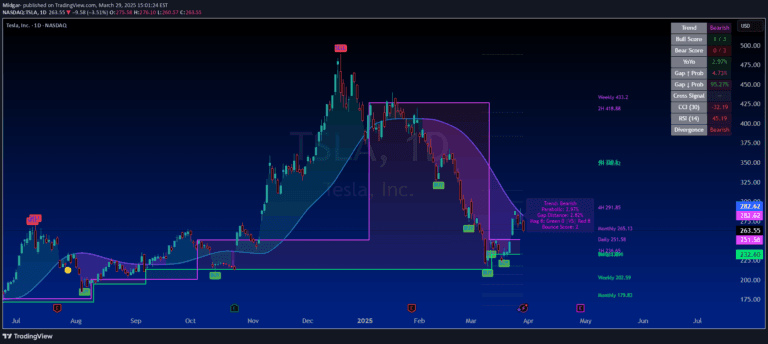
A comprehensive trading strategy combining wick trend analysis, Supertrend, and RSI to evaluate market sentiment, trend direction, and potential entry points across different timeframes.
Explore complementary indicator rolesHow it works
The signal integrates three distinct technical analysis components to generate trading insights. Wick trend analysis tracks the relative strength of price rejection by measuring upper and lower candlestick wicks, using Simple Moving Average to determine trend direction.
The Supertrend indicator utilizes Average True Range to create dynamic upper and lower bands that help identify market trend. Simultaneously, the Relative Strength Index measures price momentum by calculating the magnitude of recent price changes, ranging between 0 and 100 to indicate potential overbought or oversold conditions.
Why it may be useful
This multi-dimensional signal provides traders with a robust framework for understanding market dynamics by combining trend, momentum, and sentiment indicators. By integrating different analytical perspectives, traders can develop a more comprehensive view of potential market movements and reduce reliance on single-indicator strategies.
The signal's strength lies in its ability to confirm trading opportunities through multiple technical lenses, offering enhanced confidence in entry and exit decisions. Its flexibility across different timeframes and market conditions makes it a versatile tool for traders seeking a nuanced approach to market analysis.
When to explore it
The signal is most effective in markets with clear directional trends and moderate volatility, where price movements show consistent patterns. Traders can leverage this strategy in liquid markets like forex, stocks, and cryptocurrencies, where technical indicators can provide meaningful insights.
Optimal usage occurs when combining the signal with additional confirmation tools and risk management techniques. Traders should be particularly attentive during market transitions, such as potential trend reversals or breakout scenarios, where the integrated approach can offer more reliable signals compared to individual indicators.
Keep exploring
What we’ve verified
Access, alerts and repainting behaviour have not been independently verified for this indicator. Check the creator’s current publication and settings.
General descriptions and classifications are recovered research. Verified details above identify the specific checks we have completed. Check the creator’s current publication for later changes.