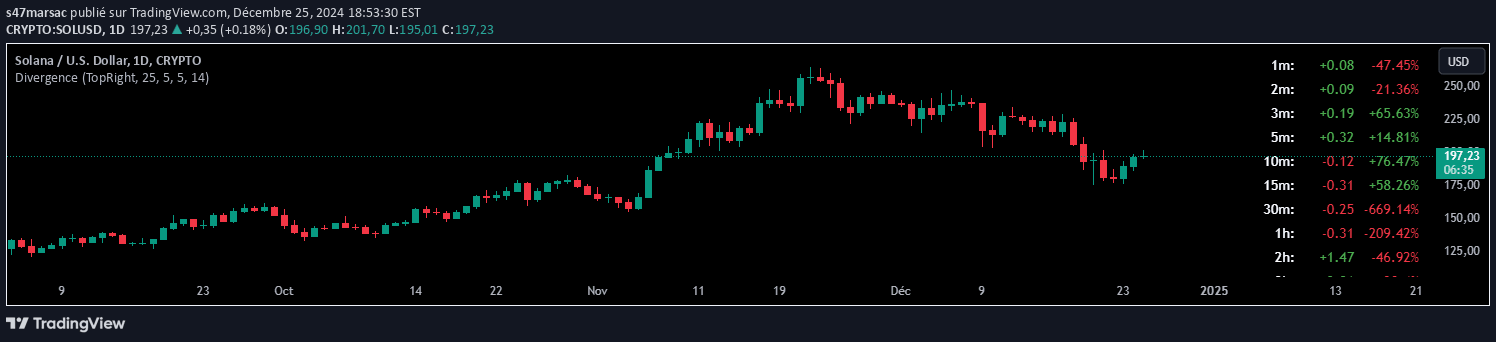
A multi-timeframe divergence tracking indicator that helps traders identify potential trend reversals and market direction by analyzing divergences across different time periods.
Explore complementary indicator rolesHow it works
The Ragi's Divergence Helper scans multiple timeframes from 5 minutes to daily charts, detecting bullish and bearish divergences between price action and momentum indicators. It systematically checks each specified timeframe and generates a color-coded dashboard that shows the divergence status for each period.
The indicator uses a fixed panel that can be positioned in different chart corners, ensuring traders can quickly assess market conditions without disrupting their primary price analysis. By comparing divergence signals across timeframes, it provides a comprehensive view of potential trend reversals or continuations.
Why it may be useful
Divergence analysis is crucial for traders seeking to identify potential trend changes before they become obvious in price action. This indicator simplifies the complex process of manually checking multiple timeframes by automating divergence detection and presenting a clear, consolidated view.
By reducing the cognitive load of analyzing different timeframes, traders can make more informed decisions about potential entry and exit points. The tool's ability to quickly summarize market conditions across various time periods helps traders develop a more holistic understanding of market dynamics.
When to explore it
The Divergence Helper is most effective when traders want to confirm trend potential across multiple timeframes and need a quick, visual representation of market momentum. It works best in markets with clear trending characteristics, where momentum indicators can provide meaningful signals about potential reversals.
Traders should use this indicator alongside other confirmation tools like RSI or price action analysis to validate the divergence signals. It is particularly useful during periods of market uncertainty, when traders need a comprehensive view of potential trend changes across different time horizons.
Keep exploring
What we’ve verified
Access, alerts and repainting behaviour have not been independently verified for this indicator. Check the creator’s current publication and settings.
General descriptions and classifications are recovered research. Verified details above identify the specific checks we have completed. Check the creator’s current publication for later changes.