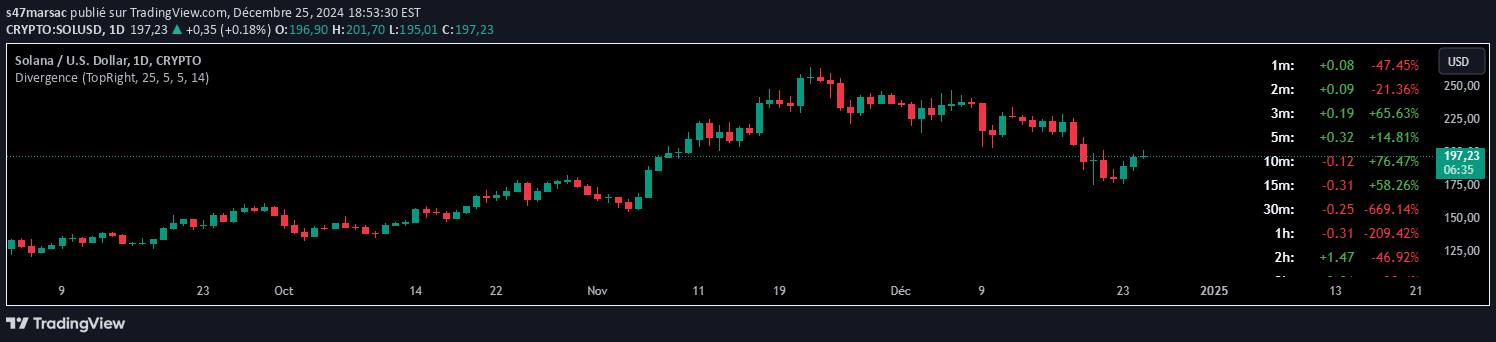
A divergence indicator that identifies mismatches between price action and technical indicators, signaling potential trend reversals or continuations across multiple timeframes.
Explore complementary indicator rolesHow it works
The divergence indicator analyzes the relationship between price movements and technical indicators by comparing their directional momentum. It detects discrepancies where price and indicator trajectories differ, highlighting potential weakness in the current trend through regular and hidden divergence patterns.
By examining multiple technical indicators simultaneously, the system calculates divergence strength using sophisticated weighting algorithms. Traders can customize pivot lookback periods and divergence detection settings to fine-tune the indicator's sensitivity and align it with their specific trading strategy and market analysis approach.
Why it may be useful
Divergence indicators provide traders with early warning signals about potential market reversals or trend continuations before they become apparent in price action. They offer an objective, quantitative method to assess market momentum and identify potential turning points that might not be visible through traditional price analysis.
By integrating multiple technical indicators and calculating a comprehensive divergence strength metric, traders gain a more nuanced understanding of market dynamics. This approach enhances decision-making by providing a multi-dimensional view of market conditions, helping traders make more informed and strategic trading choices.
When to explore it
The divergence indicator is most effective in markets with clear trending characteristics, where price and indicator movements show distinct momentum patterns. It works exceptionally well in volatile markets where rapid trend changes are common, allowing traders to anticipate potential reversals before they fully manifest.
Traders should utilize this indicator across different timeframes to confirm signals and increase reliability. It is particularly powerful when combined with other technical analysis tools, providing a comprehensive approach to market analysis that can help traders identify high-probability trading opportunities with enhanced precision.
Keep exploring
What we’ve verified
Access, alerts and repainting behaviour have not been independently verified for this indicator. Check the creator’s current publication and settings.
General descriptions and classifications are recovered research. Verified details above identify the specific checks we have completed. Check the creator’s current publication for later changes.