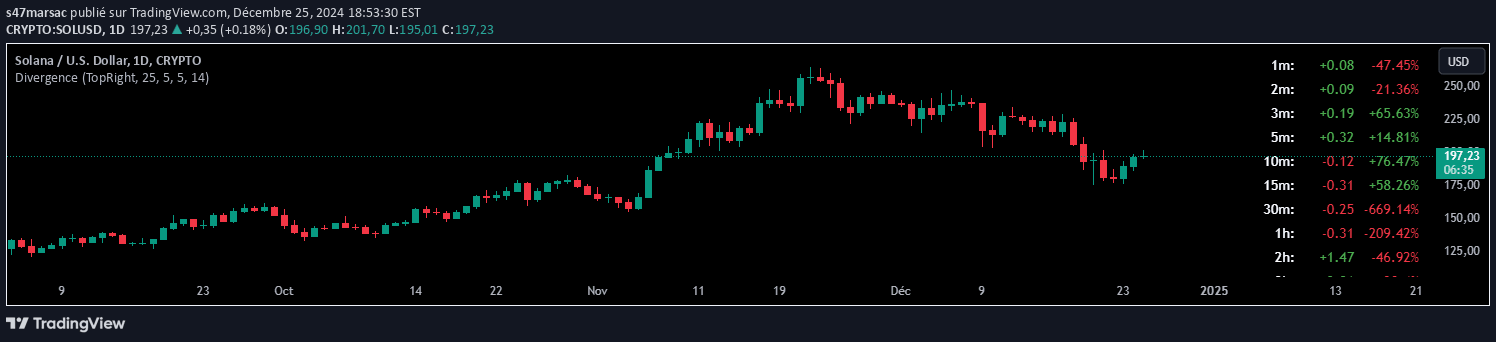
A multi-timeframe MACD indicator that analyzes market trends across different time horizons, providing comprehensive insights into price momentum and potential trading opportunities.
Explore complementary indicator rolesHow it works
The MTF MACD indicator calculates Moving Average Convergence Divergence across multiple timeframes simultaneously. It computes MACD and Signal Line values using standard parameters like fast length, slow length, and signal smoothing for each selected timeframe.
By aggregating these calculations, the indicator generates a consolidated view of market trends. It determines trading positions by analyzing the relationship between MACD and Signal Line, using color-coded backgrounds and graphical indicators to represent market conditions such as Long, Short, or Neutral.
Why it may be useful
The MTF MACD provides traders with a comprehensive perspective on market momentum across different time horizons. By synthesizing MACD calculations from multiple timeframes, it offers a more nuanced understanding of price movements and potential trend reversals.
This approach helps traders make more informed decisions by reducing the limitations of single-timeframe analysis. The indicator's visual representations and dynamic table display enable quick identification of trading opportunities, enhancing traders' ability to interpret complex market dynamics.
When to explore it
The MTF MACD is most effective in markets with clear trending characteristics, where price movements exhibit consistent directional momentum. It works particularly well when traders want to confirm trends across different time scales and validate potential entry or exit points.
Traders should utilize this indicator when seeking a comprehensive view of market trends, especially during periods of potential trend initiation or reversal. It is particularly valuable for traders who want to cross-reference multiple timeframes and gain a more holistic understanding of market behavior.
Keep exploring
What we’ve verified
Access, alerts and repainting behaviour have not been independently verified for this indicator. Check the creator’s current publication and settings.
General descriptions and classifications are recovered research. Verified details above identify the specific checks we have completed. Check the creator’s current publication for later changes.