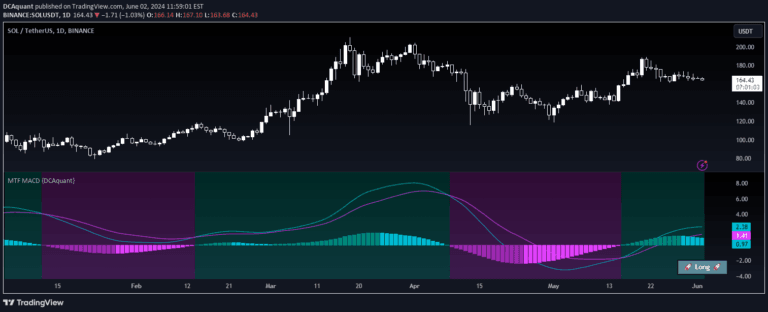
A multi-timeframe trend strength indicator that calculates percentile-based trend conditions across different time periods to assess market direction and momentum.
Explore complementary indicator rolesHow it works
The indicator calculates percentile values from high and low prices across multiple timeframes including 1 min, 5 min, 15 min, 1hr, and 4hr. It determines trend strength by computing 75th percentile high prices and 25th percentile low prices for specific Fibonacci-based periods like 13, 21, 34, 55, 89, and 144.
By establishing highest high and lowest low thresholds, the code evaluates bullish and bearish trend conditions. It counts strong and weak trend signals across different periods, creating comprehensive trend strength metrics that reveal how short-term and long-term trends interact and evolve.
Why it may be useful
Multi-timeframe analysis provides traders with a nuanced understanding of market dynamics by revealing trend consistency across different time periods. This approach helps traders identify potential trend strength, momentum, and potential trend reversals more accurately than single-timeframe indicators.
By integrating percentile calculations and Fibonacci-based periods, the indicator offers a sophisticated method of trend assessment that goes beyond traditional trend-following techniques. Traders can gain insights into market sentiment and potential directional movements with greater precision.
When to explore it
This indicator is most effective in markets with clear trending characteristics, such as forex, stocks, and cryptocurrencies. It works best when used in conjunction with other technical analysis tools to confirm trend signals and validate potential entry or exit points.
Traders should apply this indicator during periods of consistent price movement and avoid using it during highly erratic or choppy market conditions. It is particularly useful for identifying trend strength in different market timeframes and understanding the relationship between short-term and long-term price movements.
Keep exploring
What we’ve verified
Access, alerts and repainting behaviour have not been independently verified for this indicator. Check the creator’s current publication and settings.
General descriptions and classifications are recovered research. Verified details above identify the specific checks we have completed. Check the creator’s current publication for later changes.