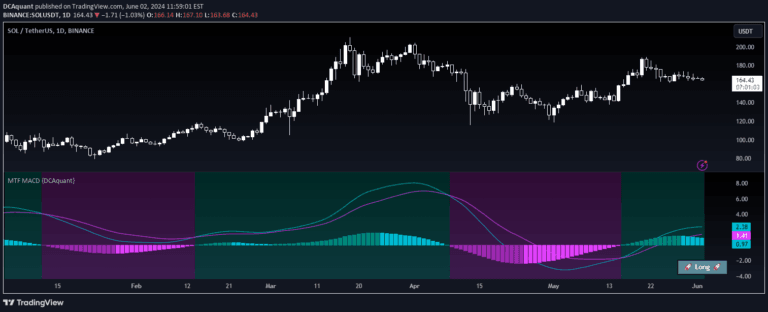
MACD is a trend-following momentum indicator that uses moving averages to identify changes in market momentum, trend reversals, and potential trading signals.
Explore complementary indicator rolesHow it works
The MACD indicator calculates the difference between two exponential moving averages, typically a 12-period and 26-period EMA, creating the MACD line. A signal line, usually a 9-period EMA of the MACD line, is then plotted alongside it to generate trading signals.
When the MACD line crosses above or below the signal line, it indicates potential trend changes. The indicator also features deviation bands that help identify unusual market volatility, with crossings outside these bands suggesting stronger potential trend movements.
Why it may be useful
The MACD is crucial for traders because it provides insights into market momentum, trend direction, and potential reversals. By combining multiple moving average calculations, it offers a nuanced view of price movement that simple trend indicators cannot provide.
Its multi-timeframe capabilities and various moving average types allow traders to customize their analysis, making it a versatile tool for understanding market dynamics and identifying potential entry and exit points across different trading styles.
When to explore it
The MACD works best in trending markets where momentum is clearly defined, helping traders identify potential trend reversals and continuation signals. It is particularly effective when combined with other technical indicators to confirm trading decisions and reduce false signals.
Traders should use the MACD in conjunction with support and resistance levels, volume analysis, and other momentum indicators to create a comprehensive trading strategy. It is most reliable when used across multiple timeframes and validated by additional technical and fundamental analysis.
Keep exploring
What we’ve verified
Access, alerts and repainting behaviour have not been independently verified for this indicator. Check the creator’s current publication and settings.
General descriptions and classifications are recovered research. Verified details above identify the specific checks we have completed. Check the creator’s current publication for later changes.