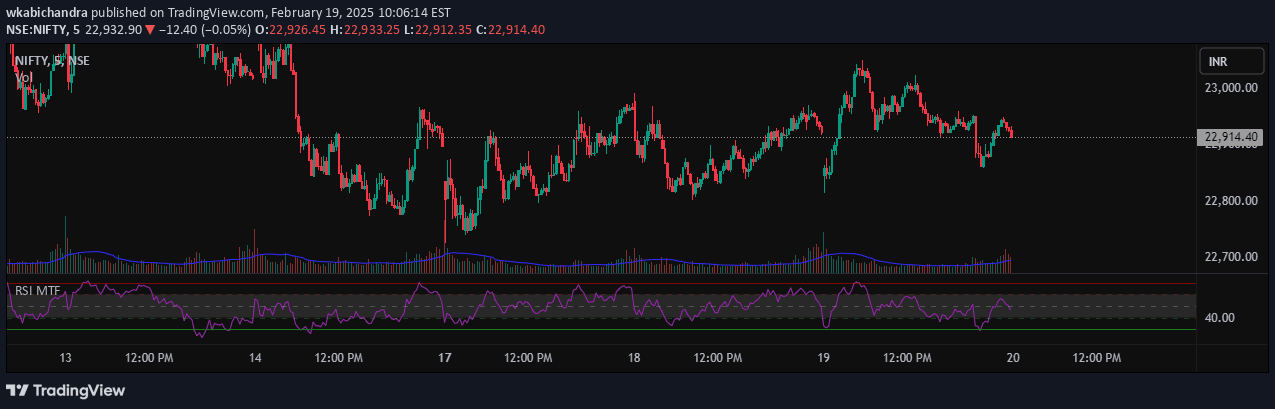
Multi-timeframe Stochastic RSI indicator that analyzes market momentum across six different timeframes, providing a color-coded visual representation of overbought and oversold conditions.
Explore complementary indicator rolesHow it works
The Multi-Timeframe Stoch RSI Indicator calculates the Stochastic RSI by applying the Stochastic oscillator to the Relative Strength Index (RSI). It computes this metric across multiple timeframes, including 5m, 15m, 30m, 1h, 3h, and 1D intervals. The indicator transforms these calculations into a visual table where each timeframe is represented by a color-coded cell.
The color coding uses red to indicate overbought conditions (🐻) and green to signify oversold conditions (✅). By analyzing these different timeframes simultaneously, traders can gain a comprehensive view of market momentum and potential trend reversals across various temporal perspectives.
Why it may be useful
The Multi-Timeframe Stoch RSI Indicator provides traders with a nuanced understanding of market dynamics by simultaneously examining momentum across multiple timeframes. This approach helps traders avoid making decisions based on isolated, short-term signals that might not represent the broader market context. By offering a holistic view, the indicator enables more informed and strategic trading decisions.
The color-coded visualization makes it easy for traders to quickly assess market conditions, reducing the cognitive load of interpreting complex technical data. Traders can rapidly identify potential entry and exit points by understanding momentum trends across different time intervals, ultimately improving their risk management and trade timing.
When to explore it
The Multi-Timeframe Stoch RSI Indicator is most effective when traders want to confirm momentum signals across different market timeframes. It is particularly useful during periods of market uncertainty or when seeking to validate potential trend reversals. Traders can use this tool to cross-reference momentum signals and increase the probability of successful trades.
The indicator works best when combined with other technical analysis tools and fundamental research. It is especially valuable for traders who operate across multiple timeframes and seek a comprehensive view of market momentum. By providing a multi-dimensional perspective, the indicator helps traders make more nuanced and informed trading decisions.
Keep exploring
What we’ve verified
Access, alerts and repainting behaviour have not been independently verified for this indicator. Check the creator’s current publication and settings.
General descriptions and classifications are recovered research. Verified details above identify the specific checks we have completed. Check the creator’s current publication for later changes.