
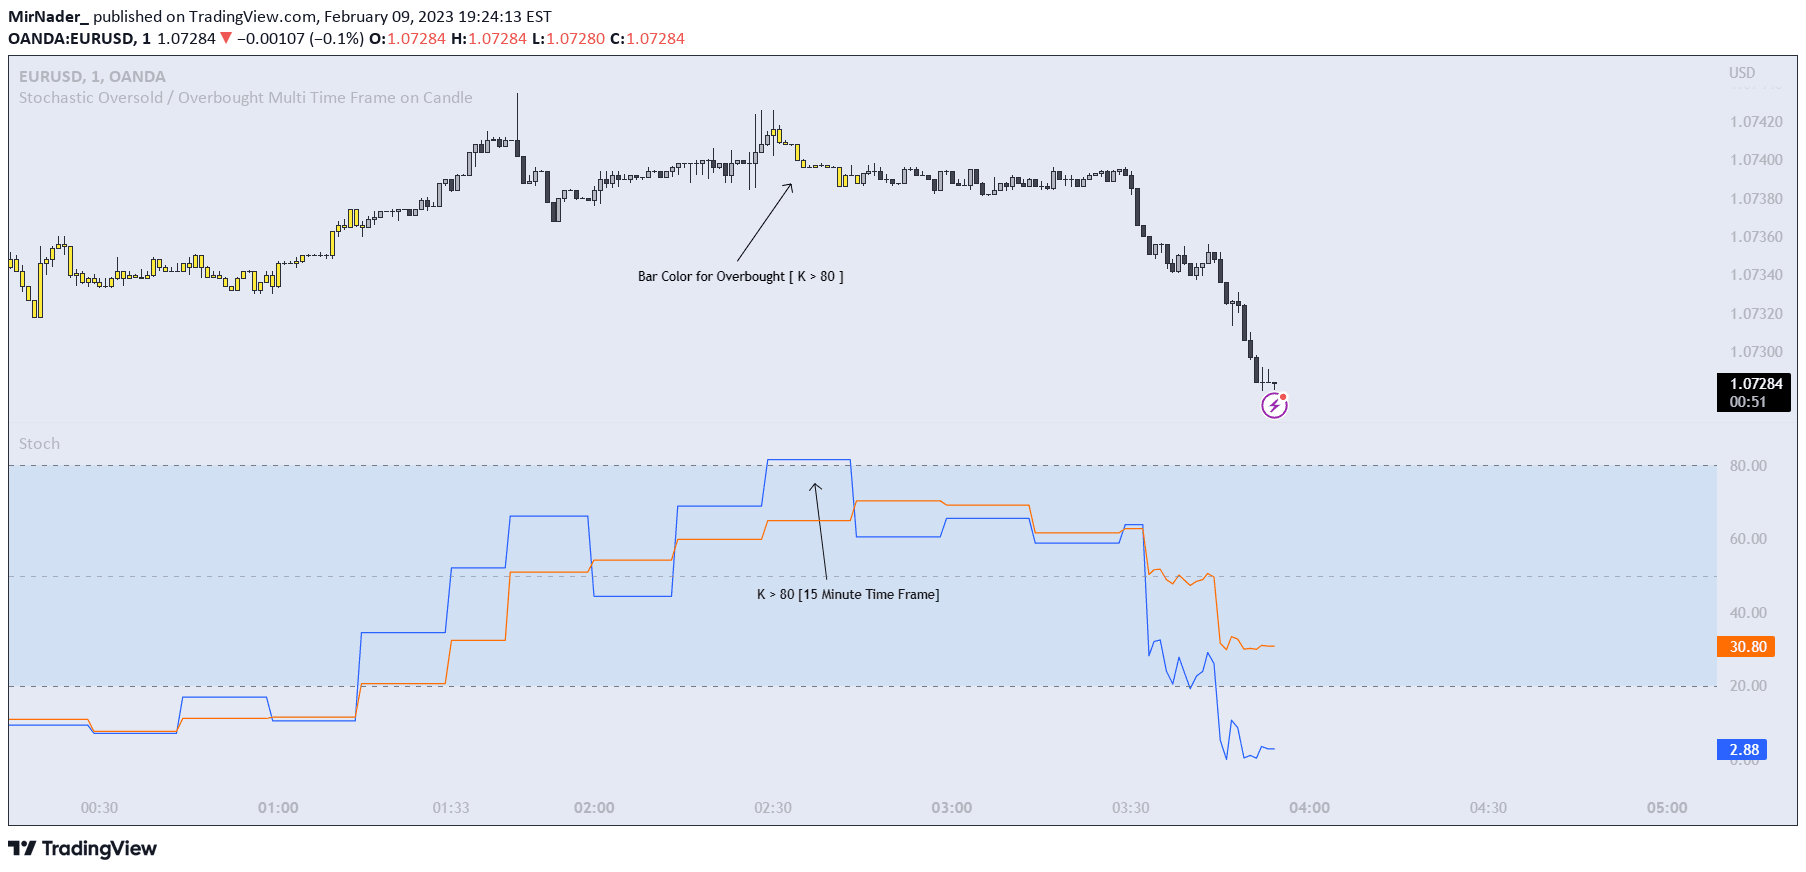
A multi-timeframe stochastic oscillator that calculates momentum across different intervals, indicating overbought and oversold conditions through color-coded candles.
Explore complementary indicator rolesHow it works
The stochastic oscillator calculates a security's closing price relative to its high-low range over a specified number of periods. It uses input parameters like %K Length and %K Smoothing to compute the oscillator across multiple timeframes, including 15-minute, 1-hour, and 4-hour intervals.
The indicator employs the ta.stoch function to calculate the oscillator and ta.sma for smoothing. It then applies color coding to candles based on whether the stochastic values are above 80 (overbought) or below 20 (oversold), providing a visual representation of momentum across different time periods.
Why it may be useful
The multi-timeframe stochastic oscillator helps traders identify potential trend reversals and momentum shifts across different trading intervals. By displaying overbought and oversold conditions through color-coded candles, it provides a quick and intuitive way to assess market dynamics and potential entry or exit points.
This approach allows traders to gain a more comprehensive view of market momentum, reducing the risk of making decisions based on a single timeframe and potentially improving trading strategy and decision-making.
When to explore it
The stochastic oscillator is most effective in markets with clear trending or ranging characteristics, where momentum and price changes are more predictable. It works best when used in conjunction with other technical analysis tools to confirm signals and reduce false positives.
Traders should be particularly attentive to this indicator during periods of market volatility, when rapid price movements can create opportunities for momentum-based trading strategies. It is especially useful for short-term traders looking to capitalize on quick market movements and trend reversals.
Keep exploring
What we’ve verified
Access, alerts and repainting behaviour have not been independently verified for this indicator. Check the creator’s current publication and settings.
General descriptions and classifications are recovered research. Verified details above identify the specific checks we have completed. Check the creator’s current publication for later changes.


