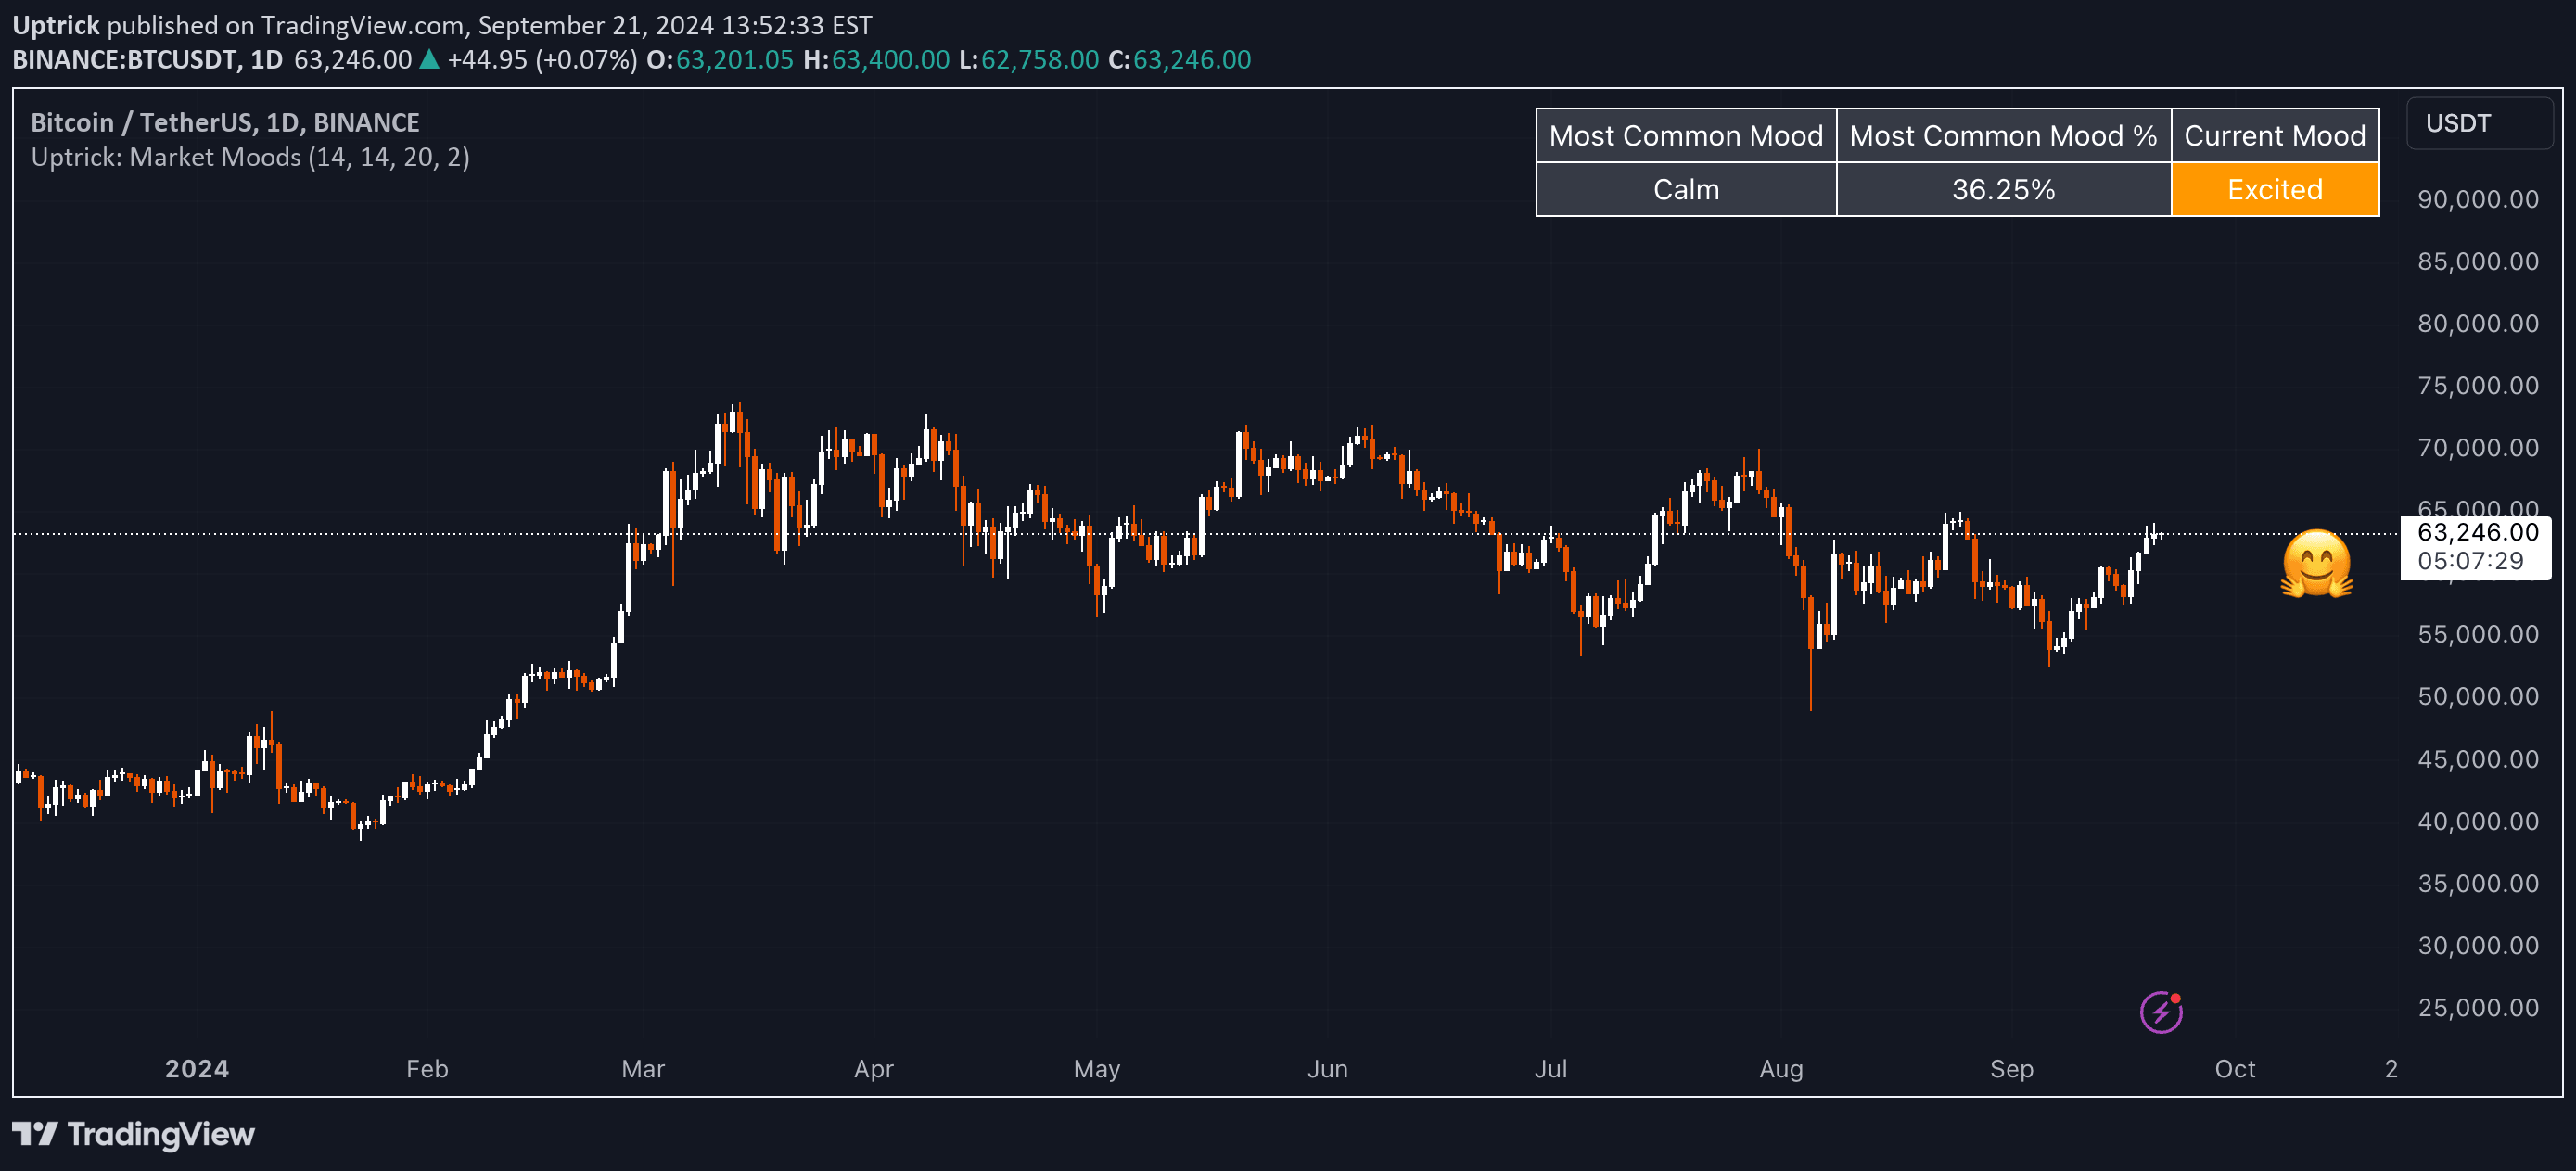
A multi-timeframe indicator combining ATR, CCI, and RSI to provide comprehensive market insights across different timeframes and help traders assess volatility and momentum simultaneously.
Explore complementary indicator rolesHow it works
The Multi Timeframe ATR, CCI & RSI indicator analyzes multiple timeframes simultaneously by integrating three key technical indicators into a single, compact table. It calculates Average True Range (ATR) to measure market volatility, Commodity Channel Index (CCI) to identify cyclical trends, and Relative Strength Index (RSI) to determine momentum strength.
Traders can customize the timeframe for these indicators, allowing flexible analysis across different market periods. The indicator provides trend arrows for CCI and RSI, helping traders quickly interpret market direction and potential trend changes with visual cues.
Why it may be useful
By consolidating multiple technical indicators into one comprehensive view, traders gain a more nuanced understanding of market conditions without switching between different charts or timeframes. The integrated approach helps identify potential trading opportunities more efficiently by providing simultaneous insights into volatility, momentum, and trend strength.
The customizable nature of this indicator allows traders to adapt their analysis to various market conditions and trading styles, making it a versatile tool for different investment strategies and timeframes.
When to explore it
This indicator is most effective during periods of market transition or when traders need a quick, comprehensive market assessment across multiple timeframes. It works particularly well when analyzing markets with complex or changing momentum characteristics, such as during trending or ranging market conditions.
Traders can leverage this tool during key market events, economic announcements, or when seeking to confirm potential trend reversals or continuations across different time horizons. Its multi-timeframe approach makes it valuable for both short-term and longer-term trading strategies.
Keep exploring
What we’ve verified
Access, alerts and repainting behaviour have not been independently verified for this indicator. Check the creator’s current publication and settings.
General descriptions and classifications are recovered research. Verified details above identify the specific checks we have completed. Check the creator’s current publication for later changes.