
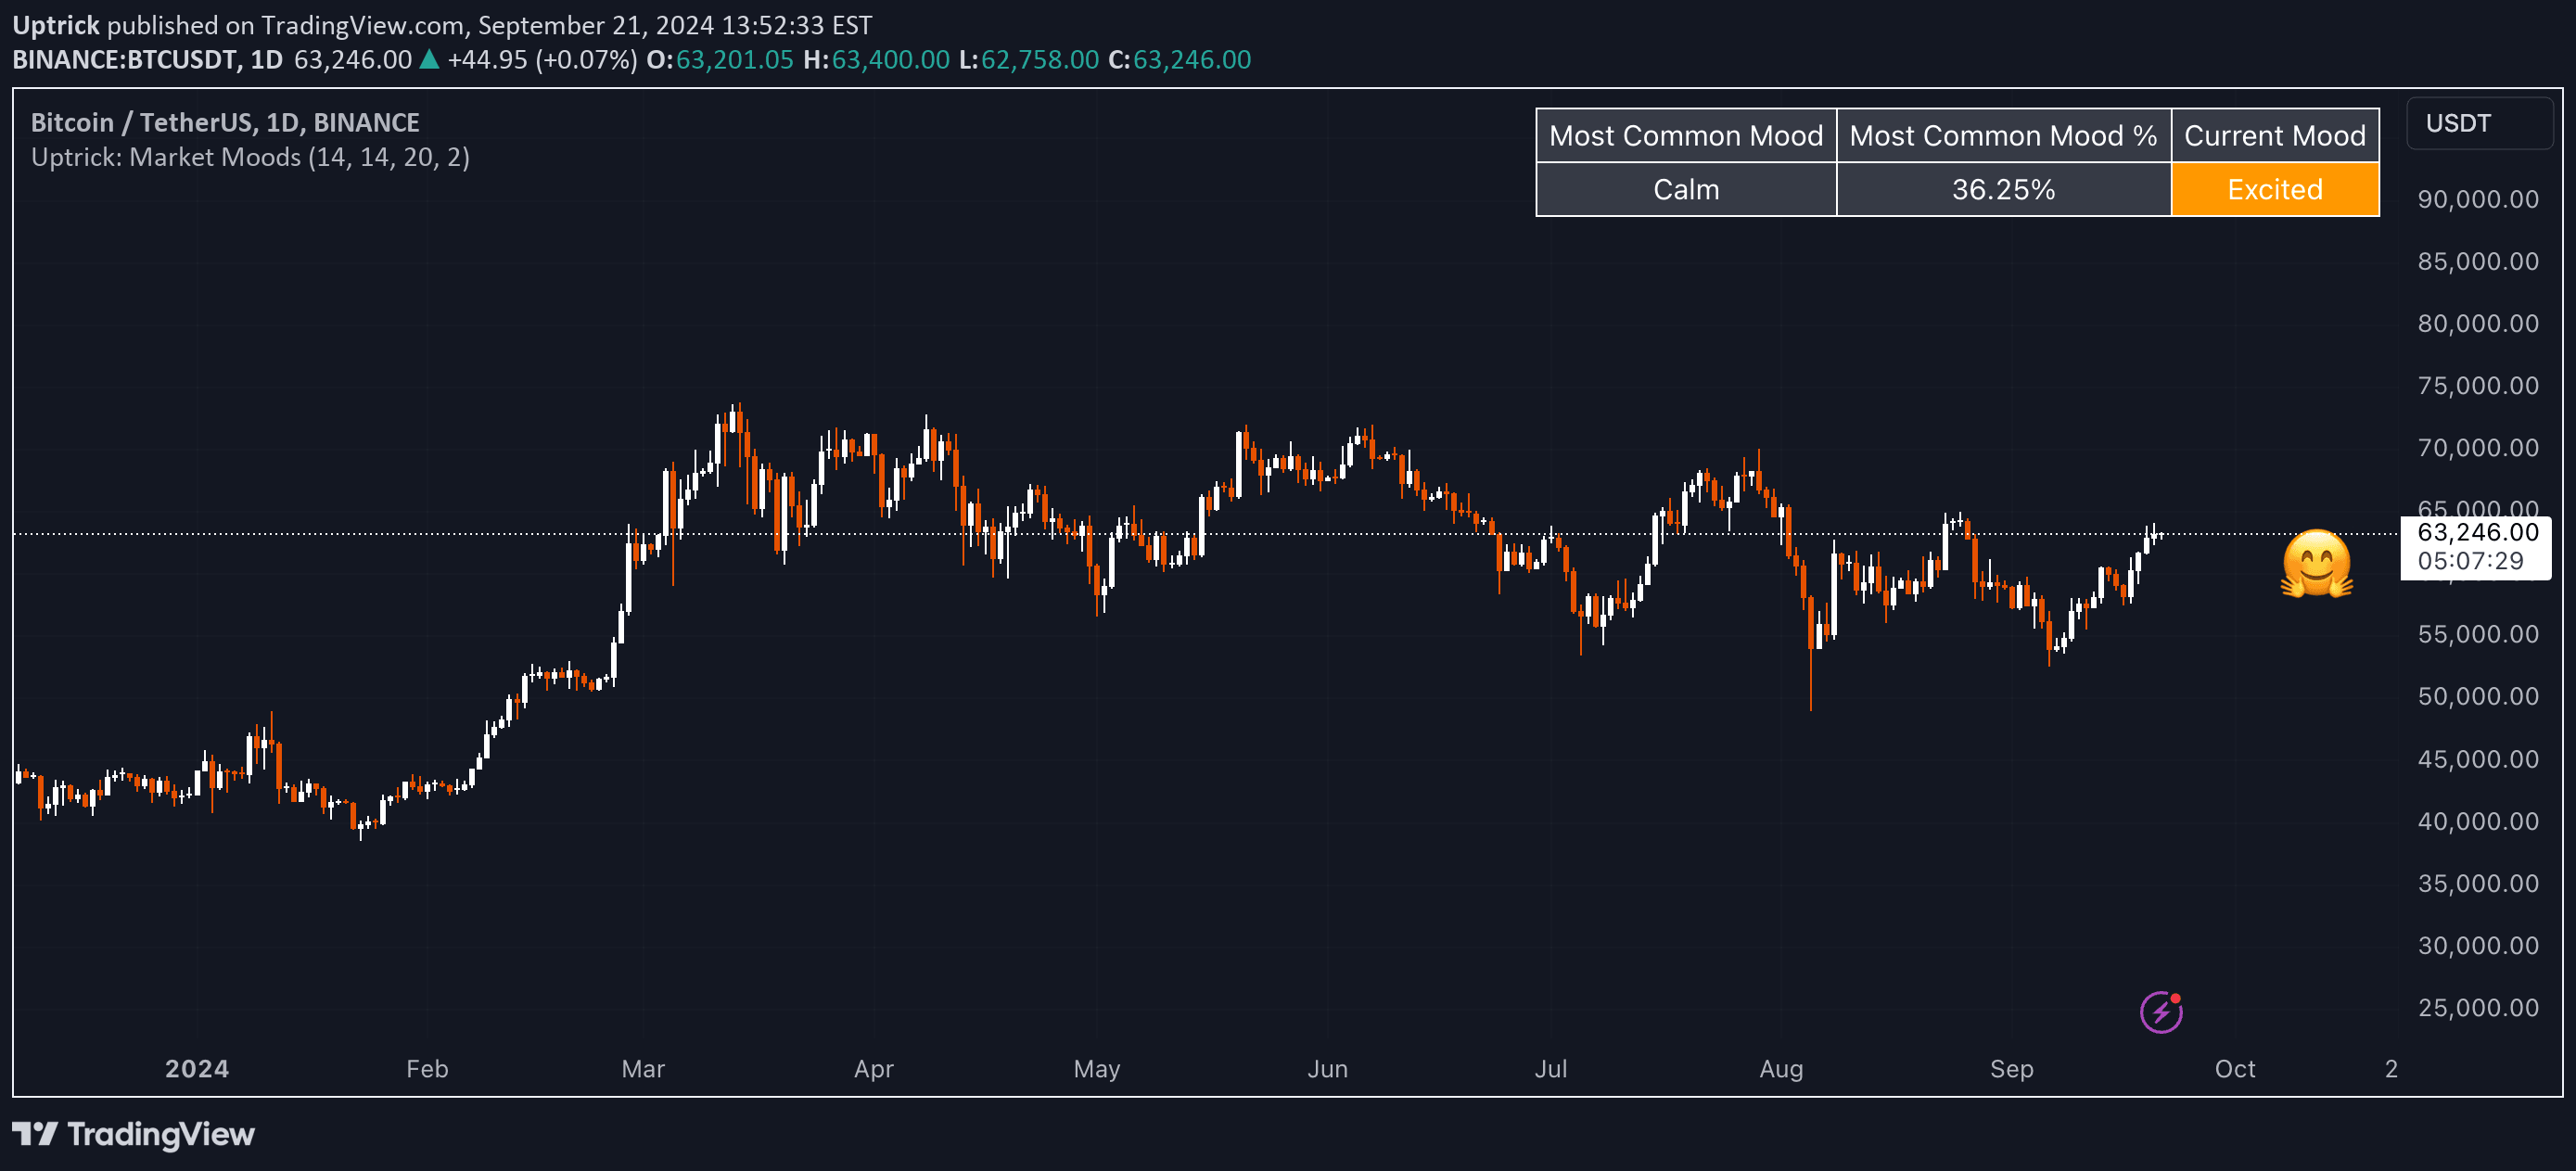
A multi-dimensional market sentiment indicator combining RSI, ATR, and Bollinger Bands to analyze market mood and provide comprehensive insights into price dynamics and emotional market states.
Explore complementary indicator rolesHow it works
The Uptrick: Market Moods indicator operates by integrating three key technical analysis tools to capture market sentiment. It uses RSI to measure momentum and identify potential overbought or oversold conditions, tracking the speed and direction of price movements. The Average True Range (ATR) component dynamically assesses market volatility by calculating price range fluctuations, providing insights into market excitement or stress levels.
Bollinger Bands complement these tools by establishing price boundaries and visualizing potential breakout conditions. By plotting standard deviations around a simple moving average, the indicator helps traders understand price deviation from typical ranges. The combination of these three elements allows the tool to create a comprehensive view of market emotional states, using color-coded visual representations and real-time calculations to help traders interpret complex market dynamics.
Why it may be useful
The Uptrick: Market Moods indicator is crucial because it moves beyond traditional single-indicator approaches, offering a holistic perspective on market behavior. By integrating multiple technical analysis tools, traders gain a more nuanced understanding of market sentiment, helping them anticipate potential trend reversals and emotional shifts in trading environments. This multi-dimensional approach provides deeper insights that can help traders make more informed decisions.
The indicator's ability to capture market mood through visual and statistical representations makes complex market analysis more accessible. Its real-time updates, interactive table, and color-coded interface allow traders to quickly understand market conditions, reducing cognitive load and enabling faster strategic responses. By synthesizing momentum, volatility, and price boundary information, the tool offers a comprehensive framework for interpreting market dynamics.
When to explore it
The Uptrick: Market Moods indicator is most effective in medium to high volatility markets where understanding emotional shifts provides a strategic advantage. It performs best when traders need a comprehensive view of market sentiment, particularly during periods of potential trend reversals or significant price movements. The indicator is particularly useful for analyzing instruments with dynamic price behavior and complex market conditions.
Traders should consider using this tool when looking to confirm signals from other analytical methods, integrate multiple technical perspectives, or gain a more nuanced understanding of market psychology. It is especially valuable when combined with volume-based tools like Volume Profile or On-Balance Volume, which can provide additional confirmation of the identified market moods. The indicator's versatility makes it suitable for various trading styles and timeframes, from scalping to swing trading.
Keep exploring
What we’ve verified
Access, alerts and repainting behaviour have not been independently verified for this indicator. Check the creator’s current publication and settings.
General descriptions and classifications are recovered research. Verified details above identify the specific checks we have completed. Check the creator’s current publication for later changes.


