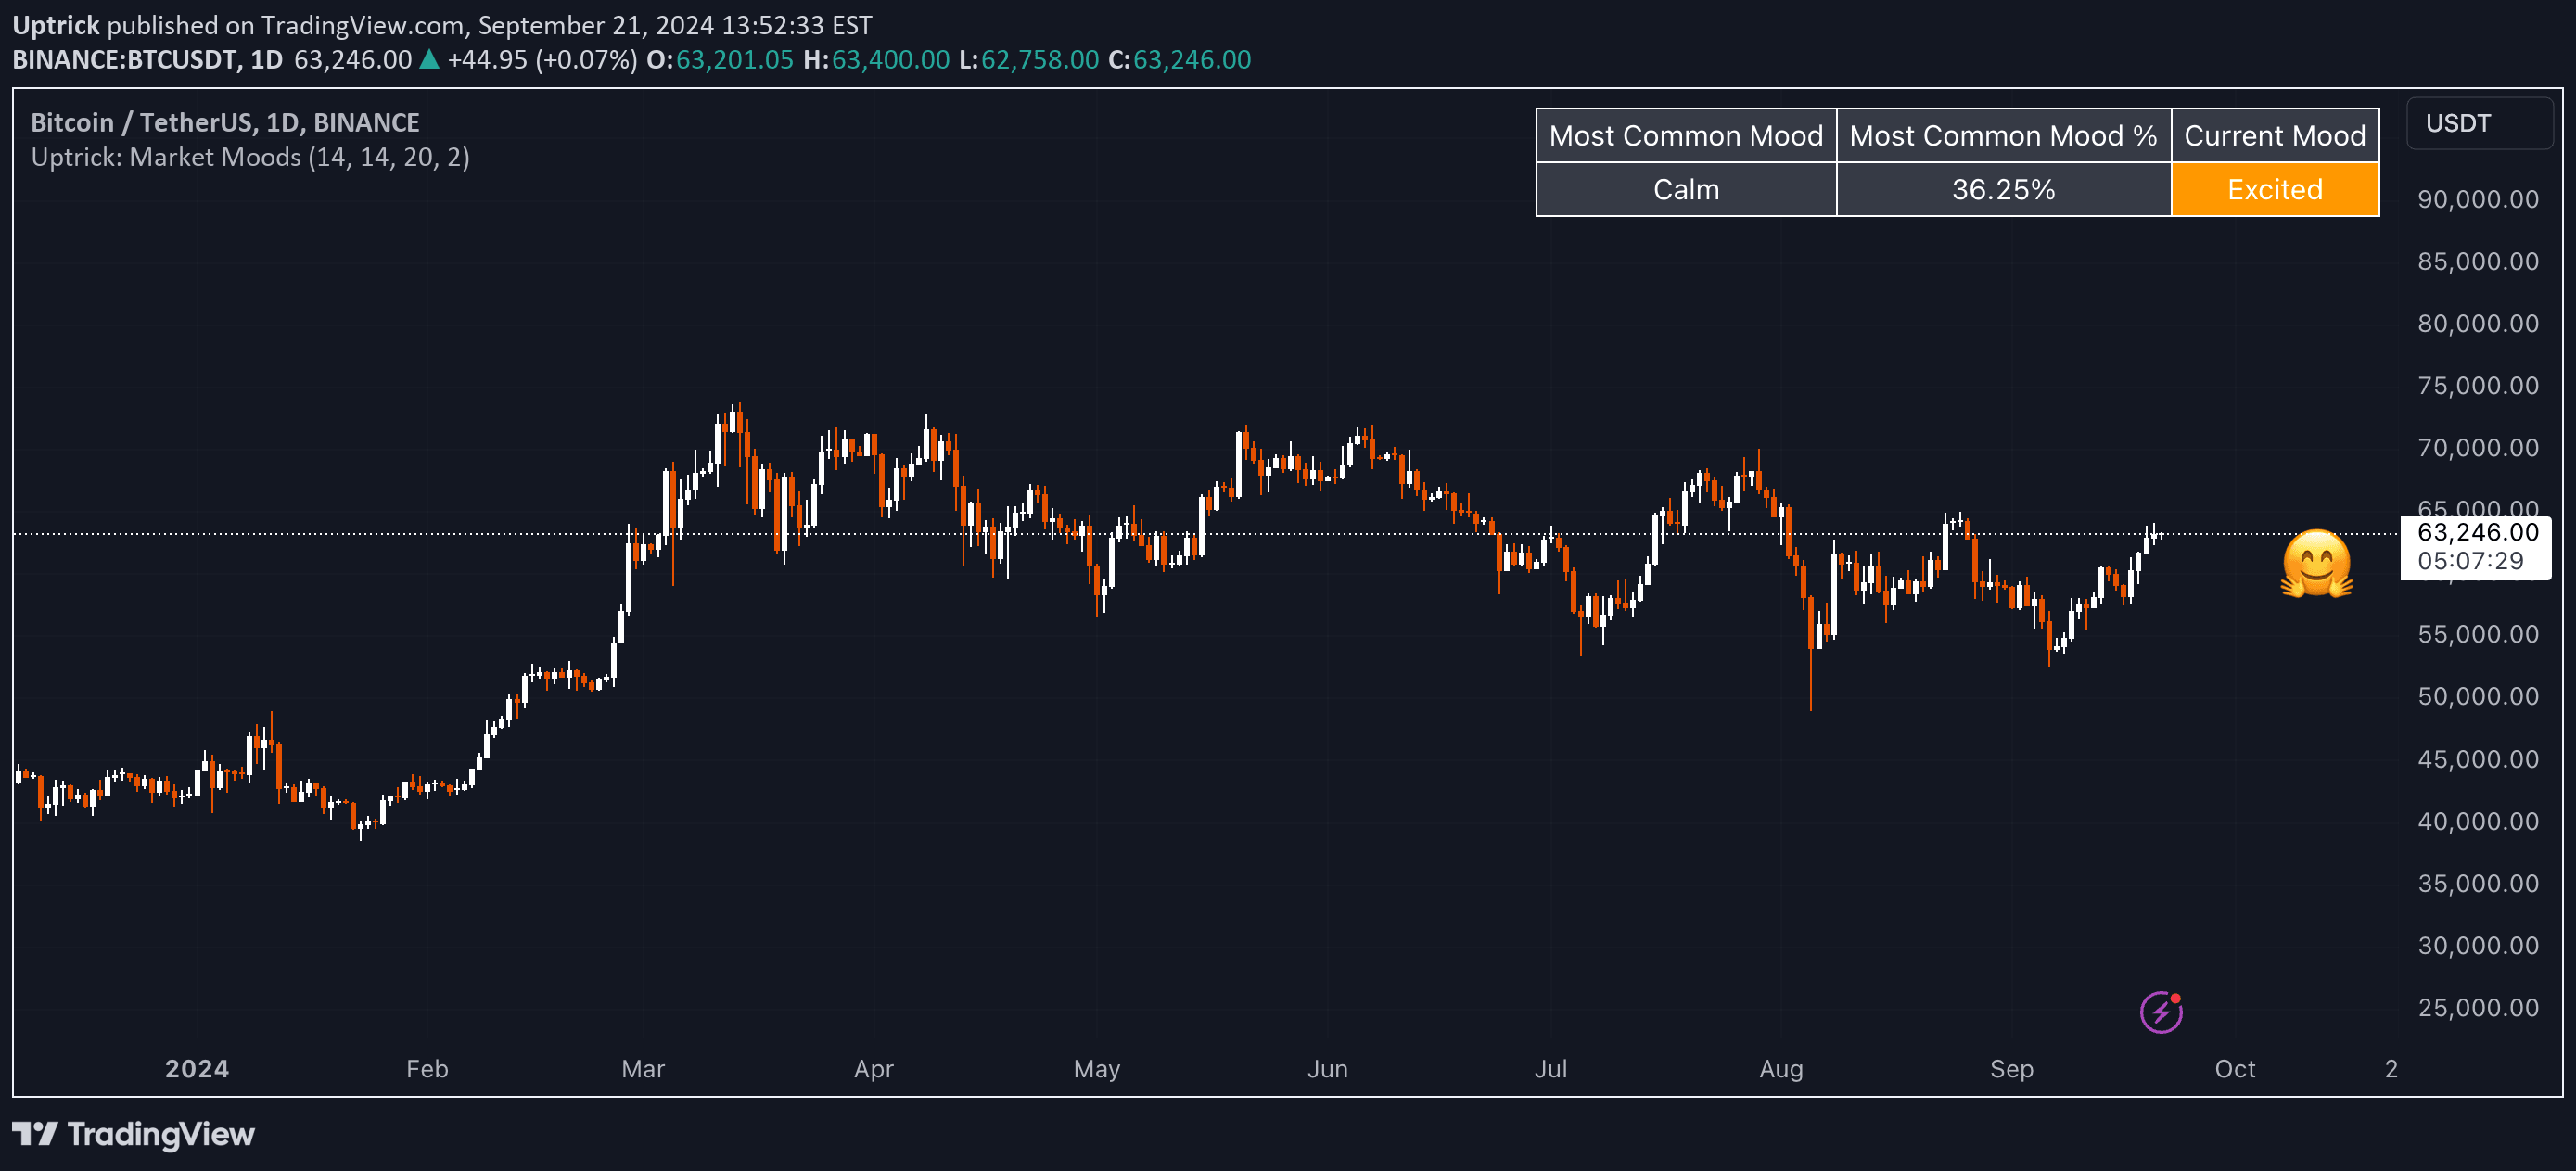
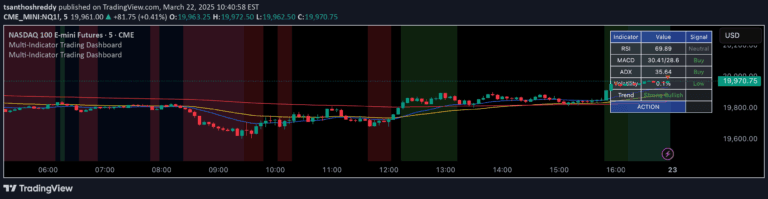
A comprehensive market overview indicator that combines close price, all-time high percentage, RSI, volume, and volatility to provide a holistic view of market conditions and potential trading opportunities.
Explore complementary indicator rolesHow it works
The indicator calculates multiple market metrics simultaneously to provide a comprehensive analysis. It tracks the current close price, computes the percentage from all-time high, measures momentum through RSI, assesses volume strength by comparing current volume to its 20-period moving average, and quantifies market volatility using Bollinger Bands width.
Each component provides a unique insight into market dynamics. The RSI uses a 14-period setting to determine potential overbought or oversold conditions, while the volume calculation reveals trading activity strength. Volatility is measured by examining the width of Bollinger Bands relative to the simple moving average, offering traders a nuanced view of potential price movements.
Why it may be useful
This comprehensive indicator helps traders make more informed decisions by providing multiple layers of market analysis in a single view. It combines price, momentum, volume, and volatility metrics, allowing traders to quickly assess market conditions and potential trading opportunities without relying on a single indicator.
By integrating various analytical perspectives, the indicator reduces the risk of making trading decisions based on incomplete information. Traders can simultaneously evaluate price trends, momentum strength, volume confirmation, and market volatility, creating a more holistic approach to market analysis and potentially improving trade entry and exit strategies.
When to explore it
The indicator is most effective during periods of market uncertainty or when traders need a comprehensive market overview. It works particularly well in trending markets where multiple confirmations are necessary to validate potential trading signals. Traders can use this indicator across different timeframes, from short-term scalping to longer-term swing trading.
Its versatility makes it valuable in volatile market conditions, helping traders identify potential trend reversals, confirm momentum, and assess market strength. By providing insights into price positioning relative to all-time highs, momentum indicators, volume strength, and volatility, the indicator helps traders make more nuanced and informed trading decisions.
Keep exploring
What we’ve verified
Access, alerts and repainting behaviour have not been independently verified for this indicator. Check the creator’s current publication and settings.
General descriptions and classifications are recovered research. Verified details above identify the specific checks we have completed. Check the creator’s current publication for later changes.