
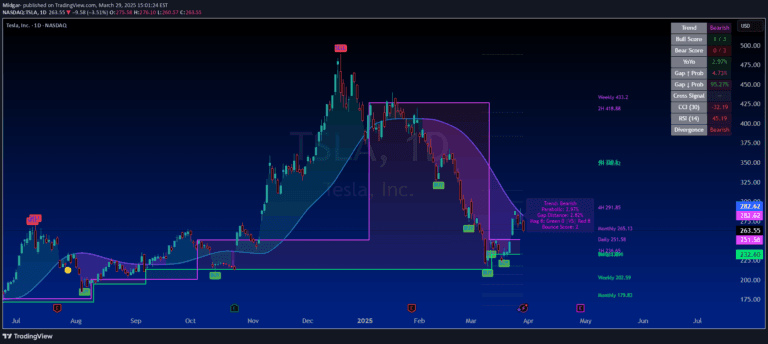
SuperTrader Trend Analysis and Trade Study Dashboard
A comprehensive trading dashboard analyzing market trends using multiple indicators like RSI, EMA, and Bollinger Bands to generate buy and sell signals with multi-confirmational strategies.
Explore 11,183 indicators. Filter beyond the obvious.
Discover the tools that fit the way you trade.
11,183 tools to explore
A comprehensive trading dashboard analyzing market trends using multiple indicators like RSI, EMA, and Bollinger Bands to generate buy and sell signals with multi-confirmational strategies.
Rikki's DikFat Bull/Bear Oscillator uses Commodity Channel Index to identify market momentum and trend direction through color-coded candles, helping traders quickly visualize bullish and bearish market conditions.
An advanced options volume scanning tool that aggregates call and put volumes across multiple strikes to detect unusual trading activity and market sentiment shifts.
A dynamic trading indicator that identifies and visualizes supply and demand zones using pivot highs and lows, helping traders spot potential support and resistance levels.
A Pine Script indicator that visually transforms price candles by coloring them based on RSI momentum, allowing traders to quickly assess market strength without leaving the primary chart.
A dynamic trading indicator that identifies potential supply and demand zones using price movements and volume spikes to help traders recognize key market reversal and entry points.
A custom TradingView indicator that analyzes options contracts by comparing the current underlying asset price to the option's strike price, visualizing in-the-money and out-of-the-money status.
A dynamic options strike visualization tool that displays nearby call and put strikes, helping traders understand market volatility and options positioning in real-time.
A TradingView indicator that calculates and displays angles of four moving averages, providing dynamic insights into trend strength and momentum using customizable moving average configurations.
The DikFat Adjusted ADXR is an advanced trend strength indicator that measures market momentum using Average Directional Index and Average Directional Movement Rating.
A specialized trading indicator for TradingView's 'The Leap' Contest that tracks and displays the maximum number of contracts allowed for different trading symbols.
Likes, views, and comments are historical TradingView snapshots. They describe attention, not trading performance.