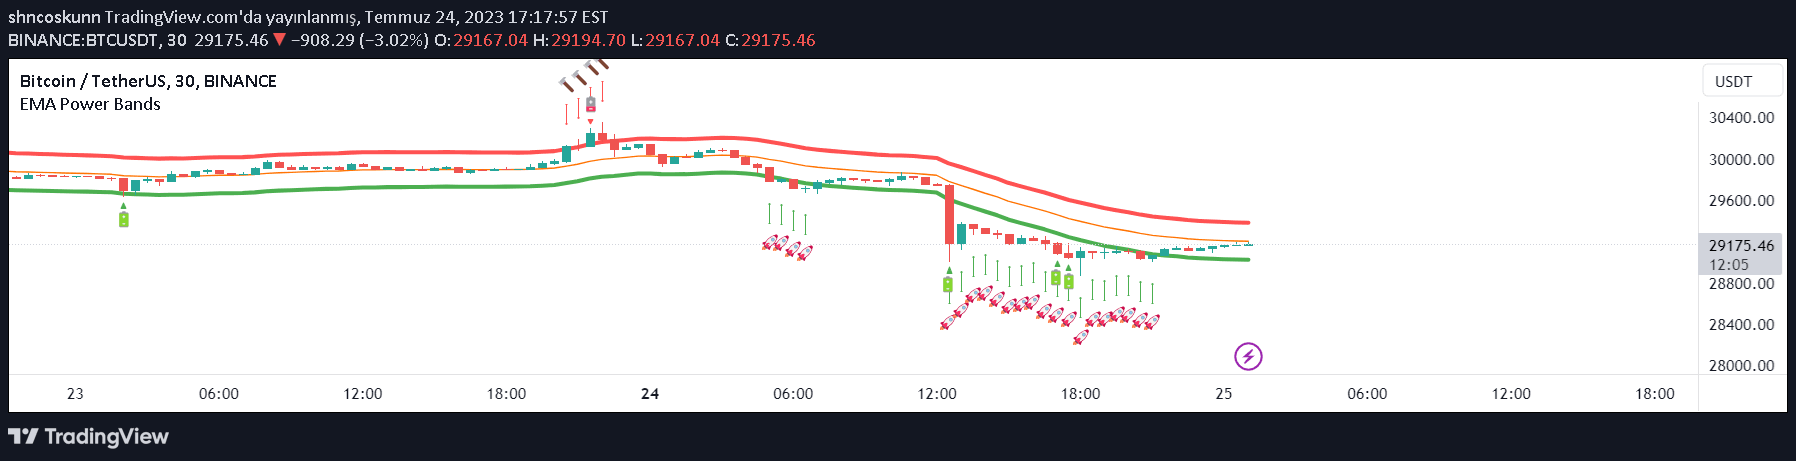
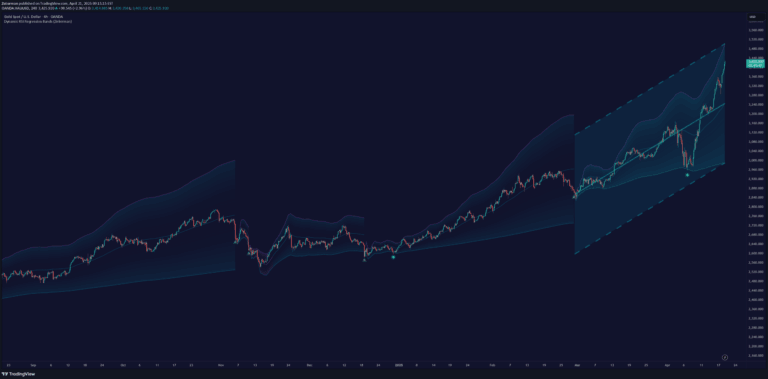
A Pine Script indicator that visually transforms price candles by coloring them based on RSI momentum, allowing traders to quickly assess market strength without leaving the primary chart.
Explore complementary indicator rolesHow it works
The indicator calculates RSI using a 14-period lookback with ta.rma() to smooth average gains and losses. It then maps the RSI value between 0 and 100 and uses this to color price candles. When RSI is above 50, candles turn bright green, signaling bullish momentum.
When RSI is below 50, candles turn bright red, indicating bearish momentum. An optional background shading feature highlights overbought (above 70) and oversold (below 30) conditions with soft green and red backgrounds respectively
Why it may be useful
This indicator simplifies momentum analysis by integrating RSI directly into price candles, eliminating the need to switch between different chart panels. By color-coding candles based on RSI, traders can quickly understand market momentum at a glance. The visual representation makes it easier to identify trend strength, potential reversals, and momentum shifts without complex calculations or additional indicators
When to explore it
The RSI candle color indicator works best in trending and range-bound markets where momentum is key. It is particularly useful for day traders and swing traders who want a quick visual reference of market sentiment.
Traders should use this alongside other technical analysis tools to confirm signals. It is most effective on liquid markets with clear trends and can help identify potential entry and exit points based on momentum changes
Keep exploring
What we’ve verified
Access, alerts and repainting behaviour have not been independently verified for this indicator. Check the creator’s current publication and settings.
General descriptions and classifications are recovered research. Verified details above identify the specific checks we have completed. Check the creator’s current publication for later changes.