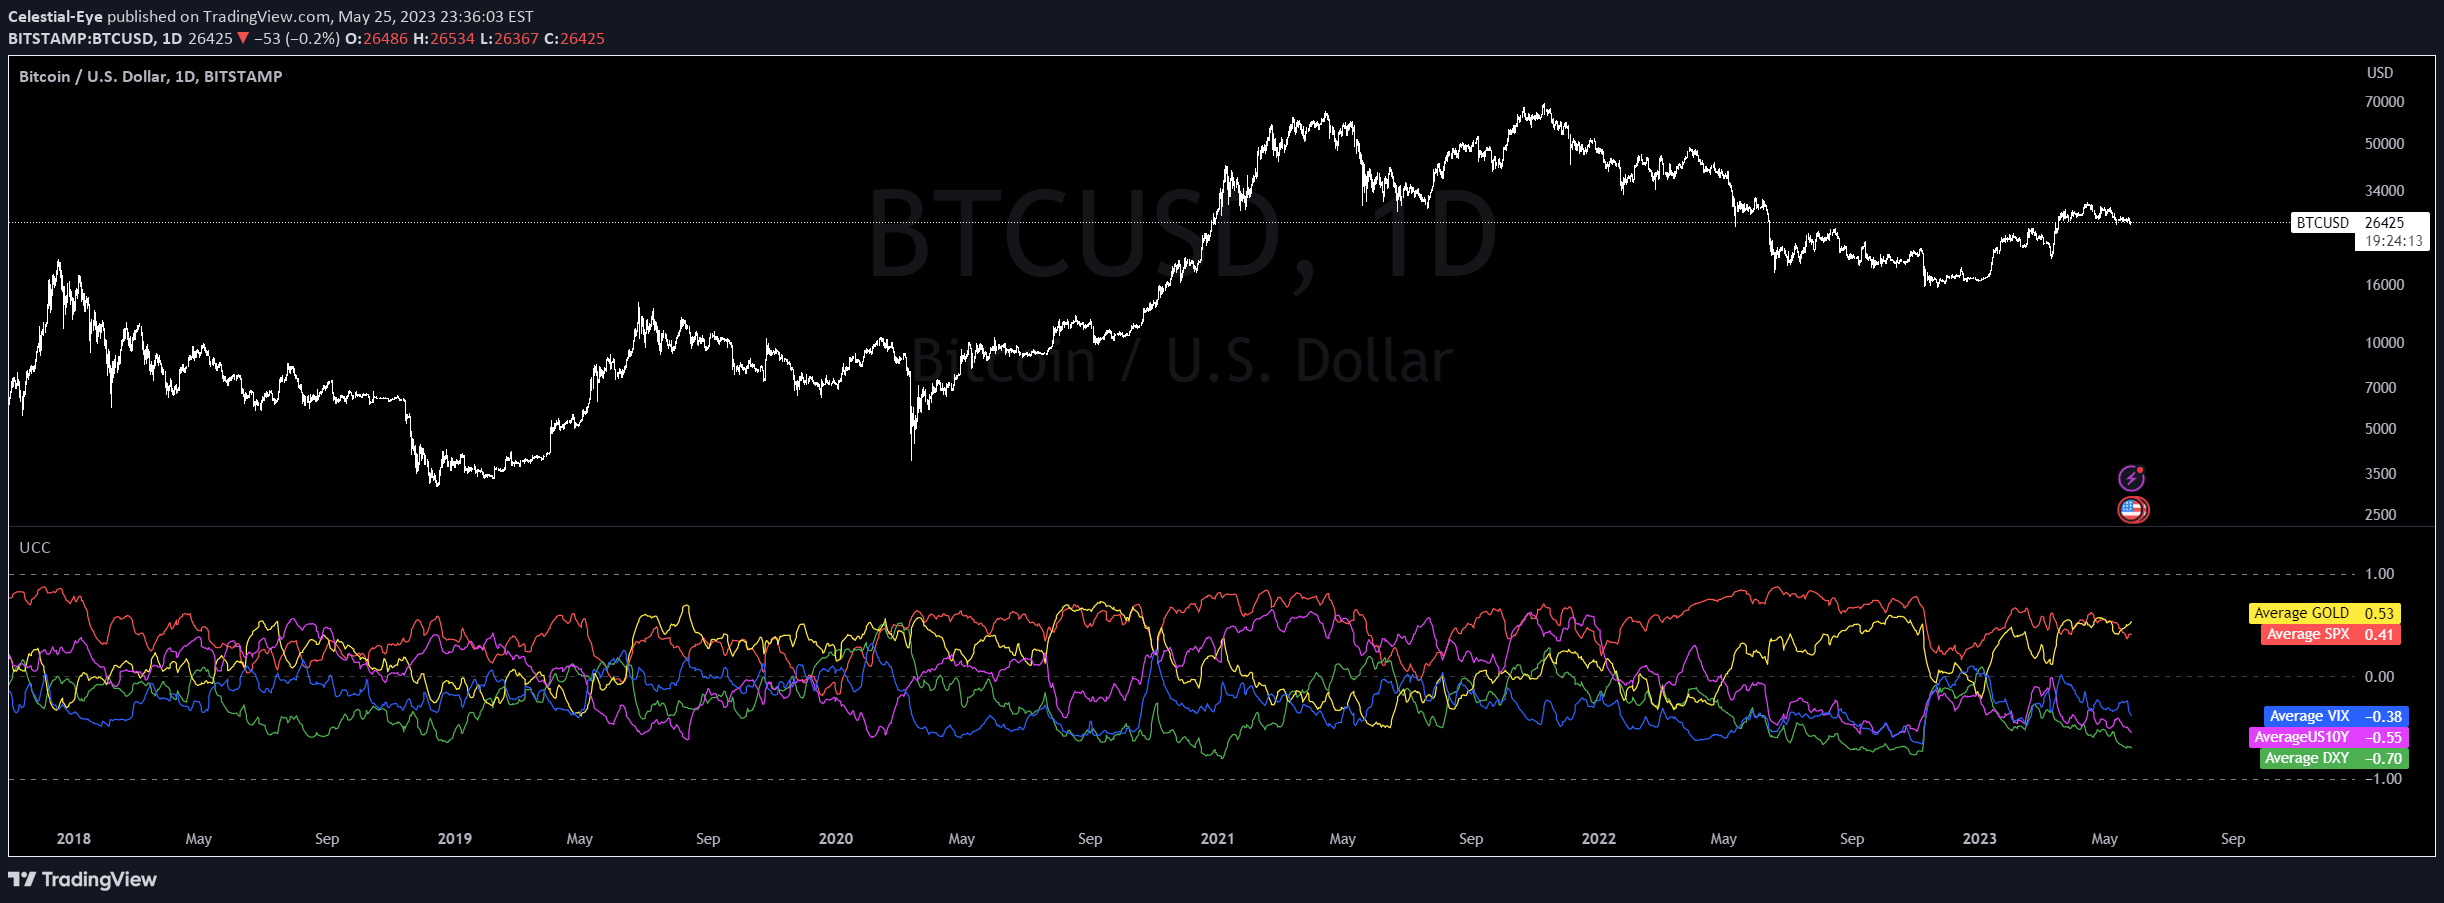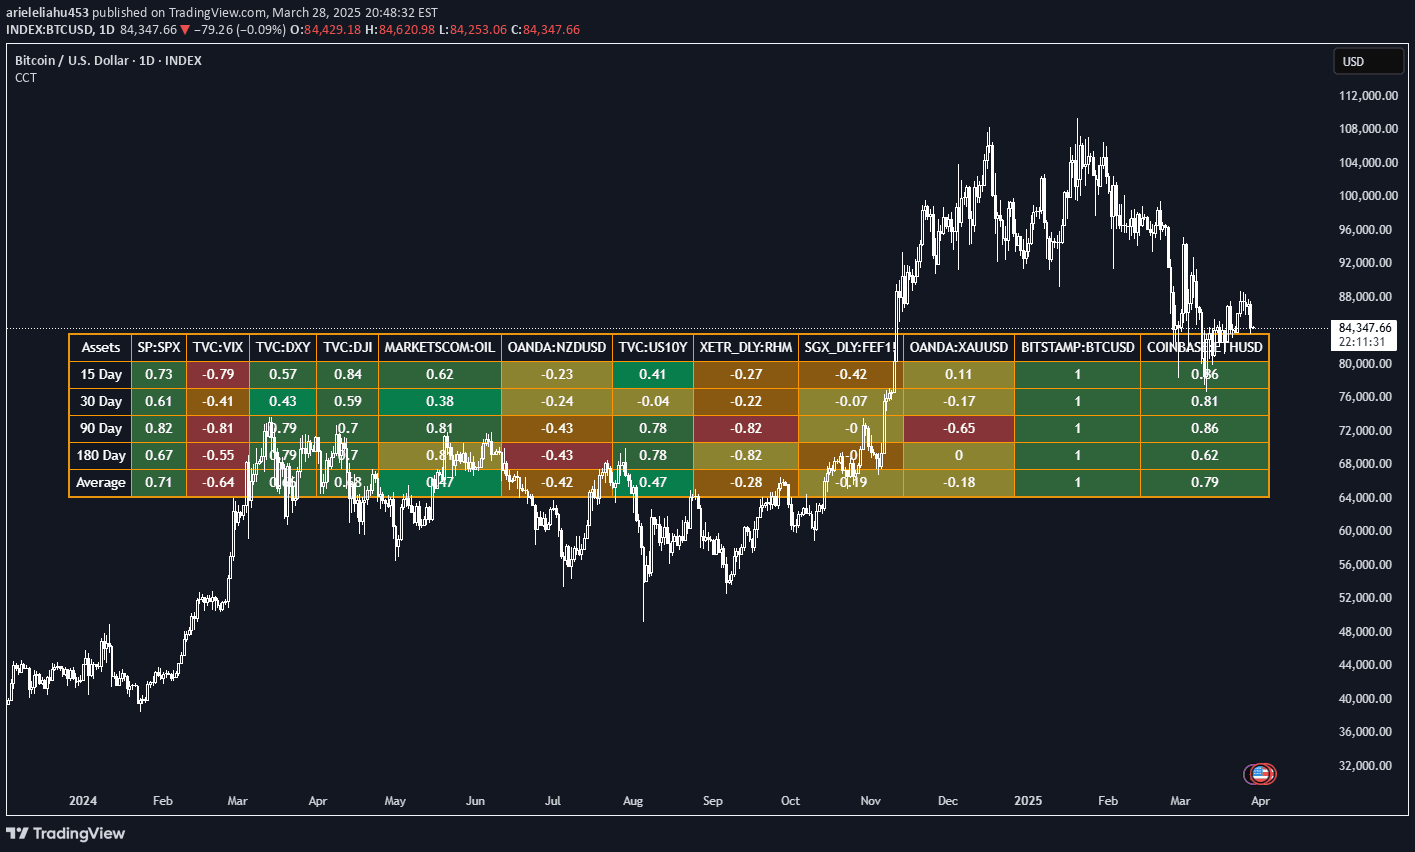
A dynamic correlation analysis tool that enables traders to compare multiple assets against a benchmark, calculating correlation values across different time periods for comprehensive market insights.
Explore complementary indicator rolesHow it works
This Pine Script creates a correlation matrix by allowing users to input up to 12 asset symbols and select a benchmark asset. It calculates correlation values across multiple time periods, such as 15, 30, 90, and 180 days.
The script computes individual correlation coefficients for each asset relative to the benchmark and generates an average correlation value. Color-coded backgrounds visually represent the correlation strength, with green indicating high positive correlation, yellow representing neutral correlation, and red signaling negative correlation
Why it may be useful
Correlation analysis helps traders understand the relationships between different assets and a benchmark, providing crucial insights into market dynamics.
By revealing how assets move in relation to each other, traders can make more informed investment decisions, manage portfolio diversification, and identify potential hedging opportunities. The multi-period approach allows for a comprehensive view of asset relationships, helping traders assess both short-term and long-term market correlations
When to explore it
This correlation tool is most effective when analyzing diversified portfolios, sector performance, and cross-market relationships. Traders can use it during market transitions, sector rotations, or when evaluating potential investment strategies.
It's particularly useful for identifying assets with low correlation to reduce portfolio risk, understanding market interdependencies, and making strategic asset allocation decisions. The tool provides valuable insights during periods of market uncertainty or when exploring new investment opportunities
Keep exploring
What we’ve verified
Access, alerts and repainting behaviour have not been independently verified for this indicator. Check the creator’s current publication and settings.
General descriptions and classifications are recovered research. Verified details above identify the specific checks we have completed. Check the creator’s current publication for later changes.