Divergence for Many Indicators v4
Advanced trading tool that detects divergences across multiple technical indicators, helping traders identify potential trend reversals and momentum shifts through comprehensive pivot point analysis.
Explore 11,183 indicators. Filter beyond the obvious.
Discover the tools that fit the way you trade.
11,183 tools to explore
Advanced trading tool that detects divergences across multiple technical indicators, helping traders identify potential trend reversals and momentum shifts through comprehensive pivot point analysis.
A multi-indicator divergence script that analyzes divergences across 10 different technical indicators to identify potential trend reversals and price movements.
A versatile divergence indicator that identifies potential trend reversals by comparing price action with an oscillator's momentum, adaptable to multiple technical indicators.
A trading signal that combines trend bias, oscillator analysis, and divergence detection to help traders make more informed decisions about trend continuation, reversal, and potential profit-taking.
An indicator that identifies divergences between swing points of a chart symbol and two external tickers, providing statistical insights into price behavior correlation.
A trading script combining Exponential Moving Averages (EMAs) and Stochastic RSI to identify market trends, momentum shifts, and potential entry or exit points for traders.
A sentiment oscillator that measures bullish and bearish market sentiment by analyzing price movements across multiple bars to provide trend and entry/exit signals.
A comprehensive divergence analysis tool that calculates divergence strength across multiple indicators, providing a single metric to assess potential market reversals and trend shifts.
A comprehensive trading toolkit combining RSI divergences, correction zones, and advanced support/resistance levels to help traders analyze market movements and potential trend reversals.
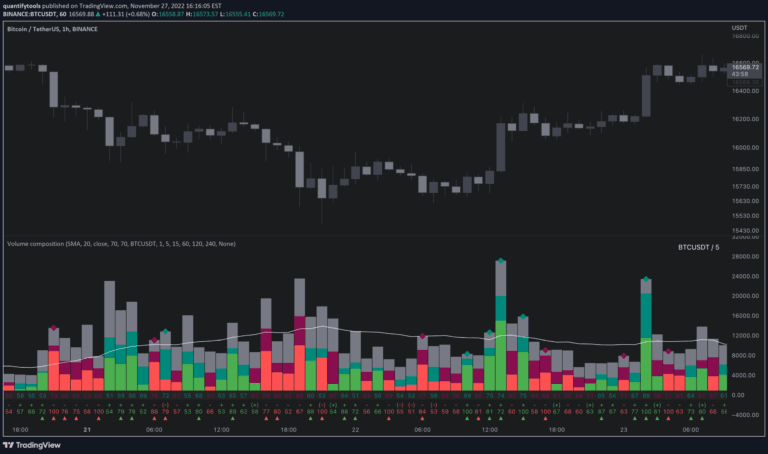
Volume composition indicator that breaks down trading volume into buy, sell, passive, and active components to provide deeper insights into market liquidity and potential price movements.
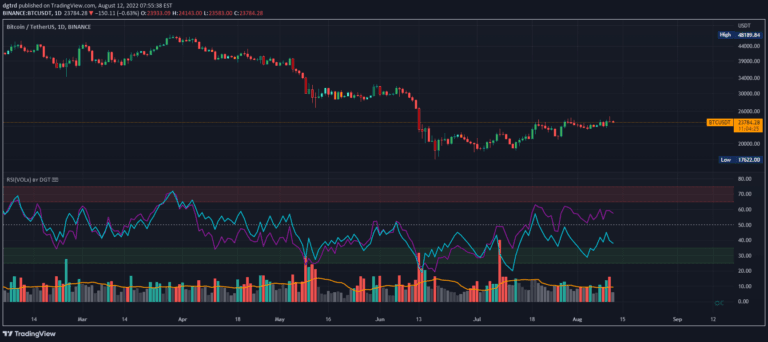
RSI is a momentum oscillator measuring price movement speed, analyzing price changes and volume to identify potential trend reversals and market conditions.
A trading signal that identifies support and resistance levels using zigzag patterns, divergence detection, and oscillator analysis to highlight potential trend reversals and market momentum shifts.
Likes, views, and comments are historical TradingView snapshots. They describe attention, not trading performance.