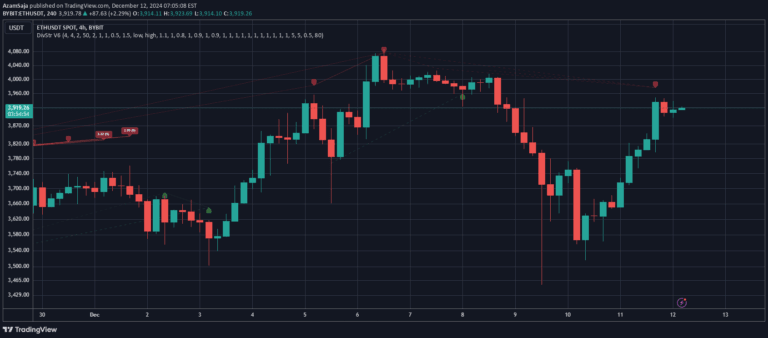
A comprehensive divergence analysis tool that calculates divergence strength across multiple indicators, providing a single metric to assess potential market reversals and trend shifts.
Explore complementary indicator rolesHow it works
The divergence strength signal calculates the magnitude of price and indicator changes using standard deviation to normalize values across different indicators. It analyzes price movement and indicator values between pivot points, creating a weighted calculation that accounts for various divergence types like regular and hidden divergence.
Each indicator's contribution is standardized and can be customized through configurable weights for RSI, OBV, MACD, and Stochastic. The tool compares price action with corresponding indicator movements to identify potential trend reversals
Why it may be useful
This divergence strength signal provides traders with a comprehensive and nuanced view of potential market reversals by aggregating multiple indicators into a single, meaningful metric. By normalizing and weighting different indicators, it offers a more robust analysis than single-indicator approaches.
Traders can quickly identify the strength and reliability of divergence signals, helping them make more informed trading decisions. The customizable nature allows adaptation to different trading styles and market conditions
When to explore it
The divergence strength signal works best during periods of potential trend exhaustion or reversal. It is particularly effective in markets showing signs of momentum slowdown or divergence between price action and technical indicators.
Traders should use this tool when comparing price movements with oscillators like RSI, MACD, and Stochastic. It is most valuable in trending markets where momentum indicators might signal emerging weakness. Optimal usage includes swing trading and day trading strategies focusing on trend reversals
Keep exploring
What we’ve verified
Access, alerts and repainting behaviour have not been independently verified for this indicator. Check the creator’s current publication and settings.
General descriptions and classifications are recovered research. Verified details above identify the specific checks we have completed. Check the creator’s current publication for later changes.