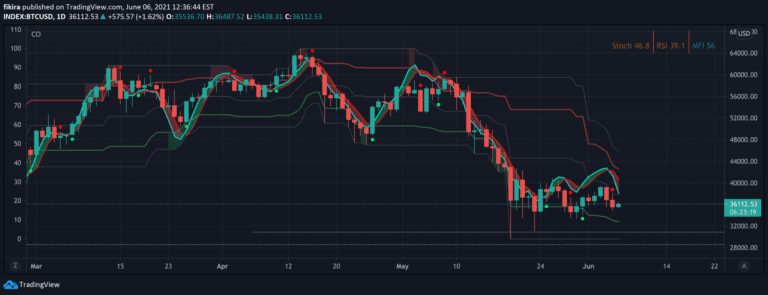
RMI Trend Sniper
The RMI Trend Sniper is a sophisticated trend-following indicator that combines RSI and MFI to generate momentum signals and identify potential market trend reversals.
Explore 11,183 indicators. Filter beyond the obvious.
Discover the tools that fit the way you trade.
11,183 tools to explore
The RMI Trend Sniper is a sophisticated trend-following indicator that combines RSI and MFI to generate momentum signals and identify potential market trend reversals.
AlphaTrend is a dynamic trend-following indicator that uses Money Flow Index or RSI to generate buy and sell signals based on trend direction and momentum crossovers.
A dynamic trading panel displaying multiple technical indicators in a color-coded table format, allowing traders to quickly assess market conditions across multiple symbols simultaneously.
A comprehensive divergence analysis tool that calculates divergence strength across multiple indicators, providing a single metric to assess potential market reversals and trend shifts.
An advanced Fibonacci Retracement tool that automatically draws levels on various technical indicators, helping traders identify potential support and resistance zones.
The SMI MFI combines Stochastic Momentum Index and Money Flow Index to measure price momentum and buying/selling pressure, providing insights into market direction and strength.
A market analysis tool that calculates probabilities of price tops and bottoms across various time periods, offering traders strategic insights into market timing and potential trend reversals.
A unique trading tool that overlays momentum oscillators within a logarithmic regression channel, providing dynamic insights into price trends and momentum positioning.
AI-powered Money Flow Index that uses machine learning to dynamically adapt MFI parameters, providing real-time insights into market trends and volume analysis.
A custom oscillator with dynamic range mapping between lowest and highest price levels, providing enhanced visualization of momentum signals directly on the price chart.
A versatile supertrend indicator that generates signals across multiple technical indicators like RSI, MFI, and volume metrics. Offers customizable range filtering and overbought/oversold configuration.
A machine learning-based technical analysis tool combining RSI and MFI to identify potential trade opportunities by calculating distances between current and historical market data points.
Likes, views, and comments are historical TradingView snapshots. They describe attention, not trading performance.