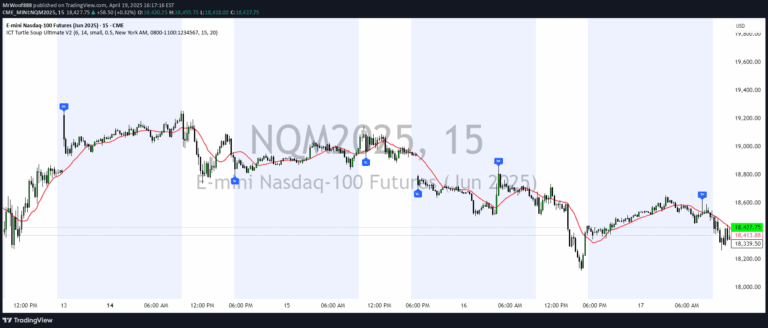
A market analysis tool that calculates probabilities of price tops and bottoms across various time periods, offering traders strategic insights into market timing and potential trend reversals.
Explore complementary indicator rolesHow it works
The High/Low Location Frequency tool systematically analyzes market data across different time frames, including hourly, daily, monthly, and yearly periods. It generates probability distributions for potential market tops and bottoms by examining historical price movements and identifying statistically significant patterns in market behavior.
Traders can customize the analysis using advanced filters that allow exclusion of specific time periods, such as particular hours, days, months, or years. These filters provide granular control over data selection, enabling more precise and targeted market analysis that can reveal nuanced insights about potential price turning points.
Why it may be useful
Understanding the probabilistic nature of market movements can significantly enhance a trader's decision-making process by providing objective, data-driven insights into potential trend reversals. By revealing statistical tendencies in price behavior, traders can develop more informed entry and exit strategies, reducing emotional trading and increasing the likelihood of successful trades.
The tool's comprehensive approach to market analysis allows traders to identify recurring patterns and seasonal variations that might otherwise go unnoticed. This deeper understanding of market dynamics can help traders anticipate potential price movements, manage risk more effectively, and develop more robust trading strategies.
When to explore it
The High/Low Location Frequency tool is most effective when traders are seeking to understand market timing and probability-based trading opportunities across different market conditions and timeframes. It is particularly valuable during periods of market uncertainty or when developing strategies that require a statistical approach to market analysis.
Traders can leverage this tool in various market environments, including trending and ranging markets, to gain insights into potential turning points. It is especially useful for developing multi-timeframe strategies, creating more comprehensive trading plans, and understanding the probabilistic nature of market movements across different financial instruments.
Keep exploring
What we’ve verified
Access, alerts and repainting behaviour have not been independently verified for this indicator. Check the creator’s current publication and settings.
General descriptions and classifications are recovered research. Verified details above identify the specific checks we have completed. Check the creator’s current publication for later changes.