Volume Profile Auto [line]
A volume profile indicator that visualizes trading volume across different time frames using lines and boxes, providing unique insights into volume distribution and market activity.
Explore 11,183 indicators. Filter beyond the obvious.
Discover the tools that fit the way you trade.
11,183 tools to explore
A volume profile indicator that visualizes trading volume across different time frames using lines and boxes, providing unique insights into volume distribution and market activity.
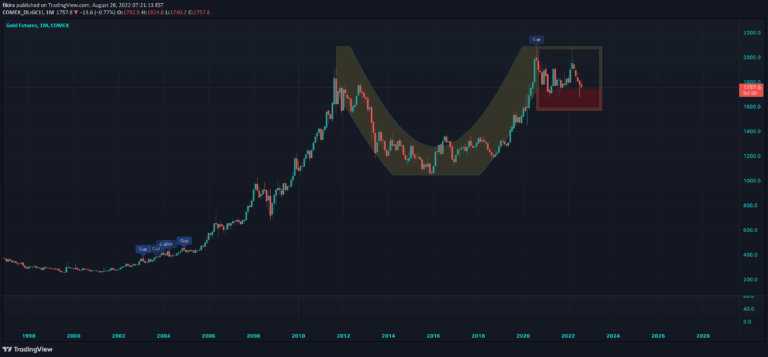
Cup & Handle is a technical chart pattern that identifies potential bullish trend continuation by analyzing price movements and pivot points, revealing possible upward breakout opportunities.
A ZigZag indicator that identifies trend changes by tracking consecutive bar closures above or below specific trigger levels, helping traders detect potential market reversals and support/resistance zones.
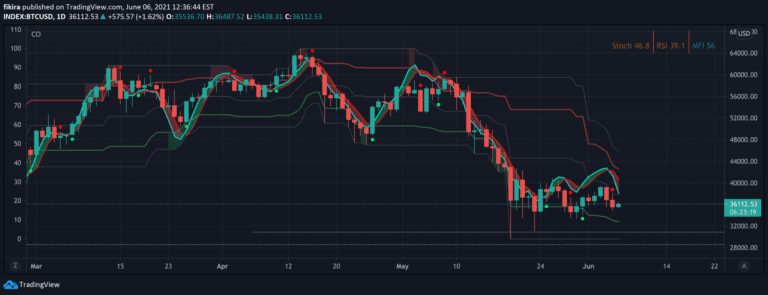
A custom oscillator with dynamic range mapping between lowest and highest price levels, providing enhanced visualization of momentum signals directly on the price chart.
A technical pattern recognition script that identifies Head & Shoulders formations by analyzing specific price points and shoulder relationships across market movements.
A Pine Script technique for combining multiple cryptocurrency price data into a single composite ticker using advanced request.security() method, enabling efficient multi-ticker analysis.
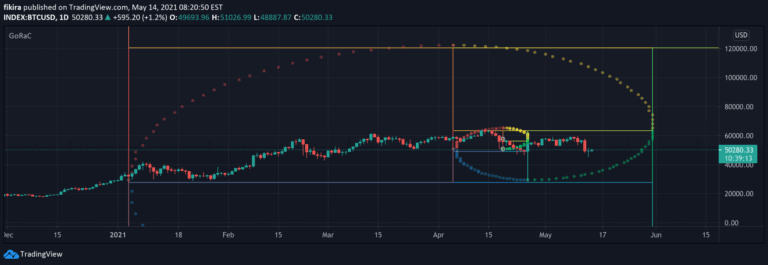
A Pine Script method demonstrating a custom Flare indicator that analyzes price positioning relative to a historical point, using color-coded visual signals to indicate market zones.
A trading technique using Golden ratio cubes to analyze price differences between two points, helping identify potential support and resistance areas with multiple visualization options.
A multi-RSI plotting technique that allows customization of five different RSI indicators with varying parameters like source, length, timeframe, color, and visual representation.
Price Volume Scatter Plot is an advanced visualization tool that maps intrabar price and volume data, revealing detailed trading behavior across price levels using a comprehensive scatter representation.
ICT Silver Bullet indicator identifies Fair Value Gaps and potential support/resistance levels during specific market sessions, providing visual trading insights and signals.
Advanced harmonic pattern detection tool that identifies 75 unique geometric trading patterns across multiple timeframes using precise Fibonacci ratio calculations and ZigZag line analysis.
Likes, views, and comments are historical TradingView snapshots. They describe attention, not trading performance.