
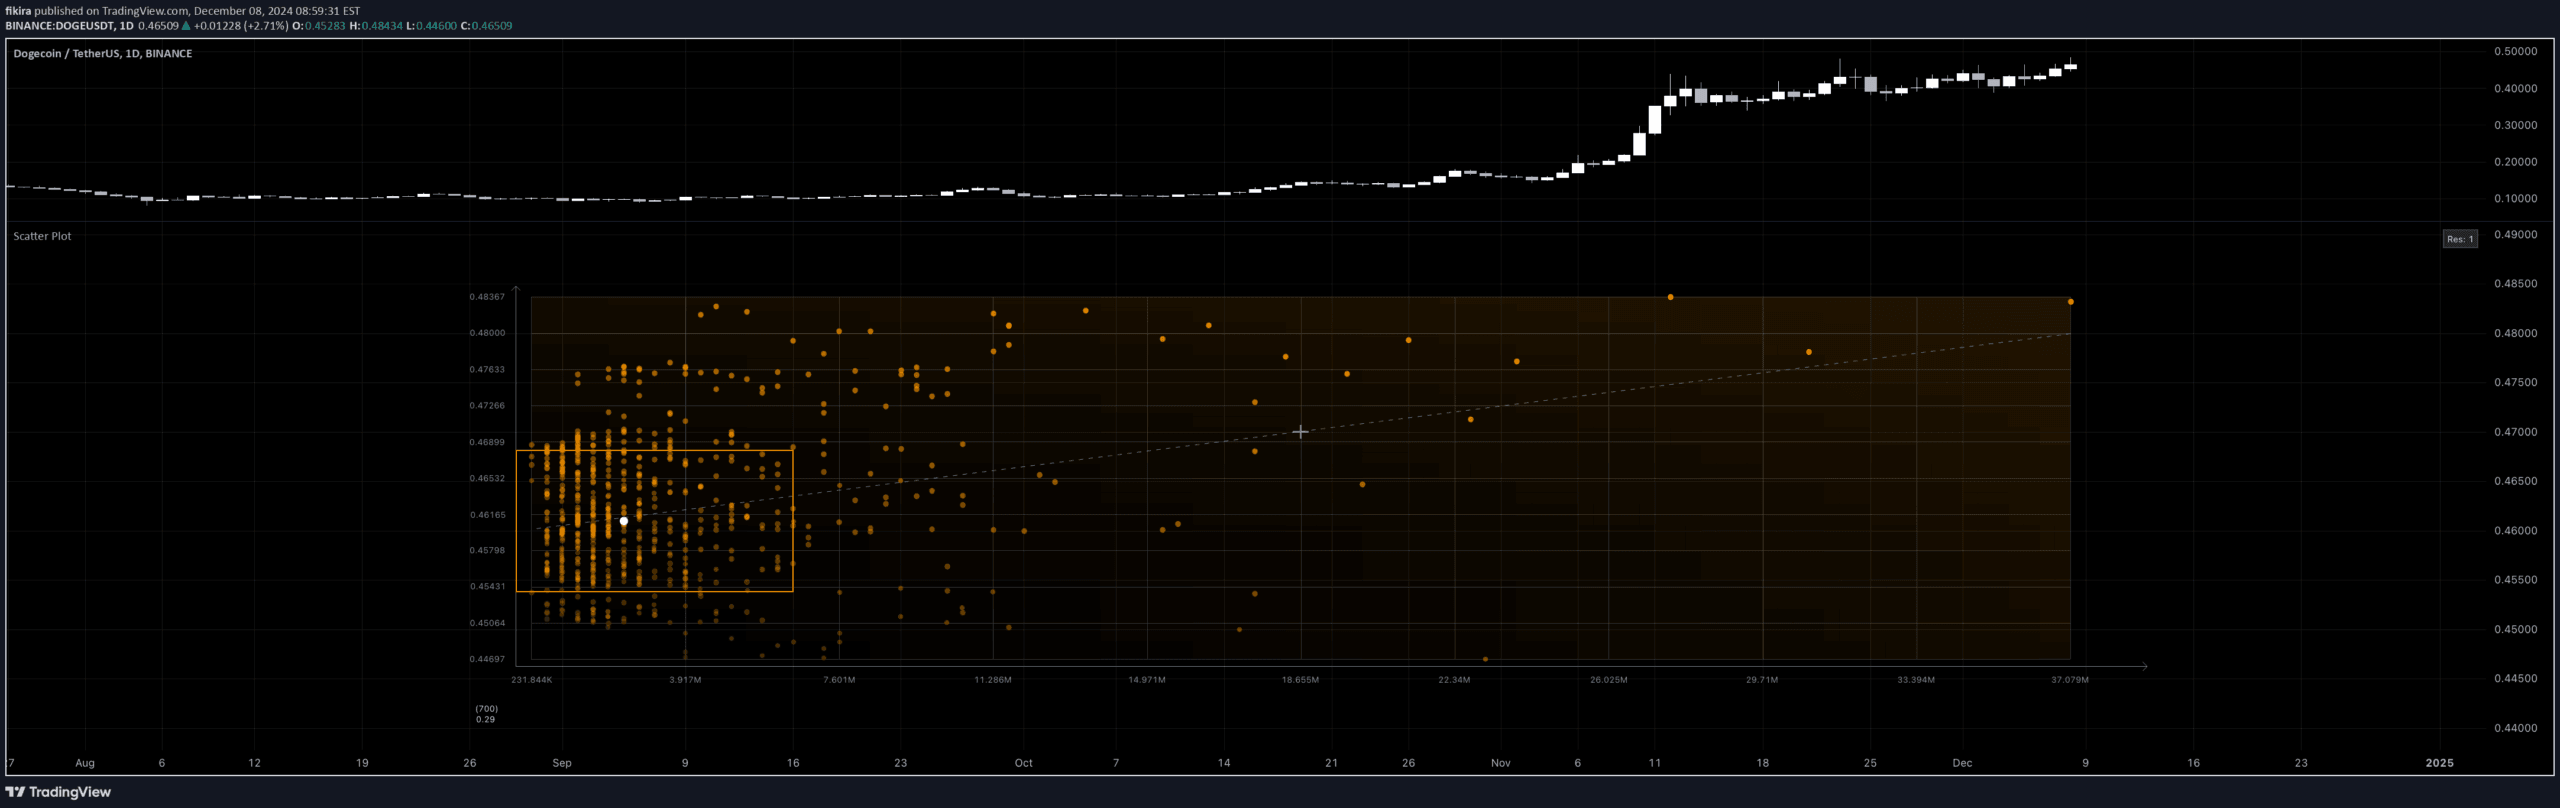
Price Volume Scatter Plot is an advanced visualization tool that maps intrabar price and volume data, revealing detailed trading behavior across price levels using a comprehensive scatter representation.
Explore complementary indicator rolesHow it works
The Price Volume Scatter Plot creates a graphical representation of price and volume data by plotting dots that represent each intrabar close price and its corresponding trading volume. Each dot's position indicates the specific price level and volume traded at that point.
The plot includes a linear regression line (line of best fit) to help identify underlying price trends. Volumes at the same price level are cumulated, meaning multiple closes at a price point consolidate into a single dot. The scatter plot can be configured in four different axis directions and offers multiple visual customization options
Why it may be useful
The Price Volume Scatter Plot provides traders with a unique, detailed perspective on trading dynamics by visualizing volume distribution across price levels. It offers more nuanced insights compared to traditional volume profiles by showing precise volume concentrations at specific prices.
Traders can quickly identify price areas with significant trading activity, potential support and resistance zones, and underlying market sentiment. The accompanying linear regression line helps interpret overall price direction, making complex volume data more accessible and interpretable
When to explore it
This indicator works best when analyzing markets with sufficient historical data, ideally charts containing at least 100 bars. It is particularly useful for day traders and swing traders seeking granular insights into volume behavior.
Traders can leverage this tool when evaluating market structure, identifying potential reversal zones, and understanding volume concentration at different price levels. It is most effective in liquid markets with consistent trading activity where volume data provides meaningful insights into market dynamics
Keep exploring
What we’ve verified
Access, alerts and repainting behaviour have not been independently verified for this indicator. Check the creator’s current publication and settings.
General descriptions and classifications are recovered research. Verified details above identify the specific checks we have completed. Check the creator’s current publication for later changes.


