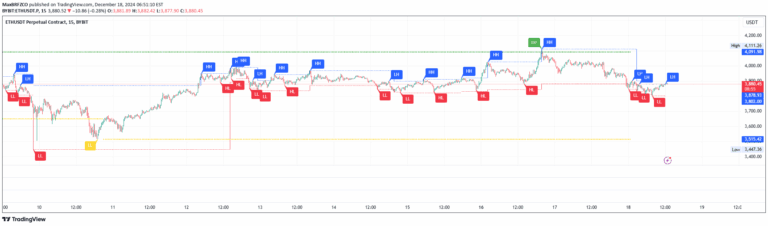
A trading technique using Golden ratio cubes to analyze price differences between two points, helping identify potential support and resistance areas with multiple visualization options.
Explore complementary indicator rolesHow it works
The Golden ratio cubes indicator calculates and plots the difference between two specific price points, which can be high/low or maximum/minimum of open and close prices. Traders can select different resolutions, such as weekly or daily charts, to analyze price movements.
The indicator extends lines to help visualize potential support and resistance areas. Users can adjust the number of bars back to examine previous periods, allowing for dynamic analysis of price relationships. By plotting these differences using geometric principles, the indicator provides a unique perspective on price action and potential market trends
Why it may be useful
This indicator offers traders a sophisticated method of identifying market dynamics by leveraging mathematical relationships between price points. The Golden ratio cubes provide a visual representation of price movements that can reveal hidden patterns and potential trend reversals.
By extending lines and examining different price point combinations, traders can gain insights into market structure and potential future price behavior. The flexibility of choosing different resolution levels and bar configurations allows for adaptable analysis across various trading scenarios. Understanding these geometric price relationships can help traders make more informed decisions
When to explore it
The Golden ratio cubes indicator works best in markets with clear trending characteristics and when seeking to identify potential support and resistance levels. It is particularly useful for swing traders and day traders analyzing weekly or daily charts. Traders should use this indicator in conjunction with other technical analysis tools to confirm signals and reduce false positives.
The technique is most effective in relatively stable market conditions where price movements show discernible patterns. Avoid using during extreme market volatility or news-driven price spikes. Consider combining this method with volume analysis and trend confirmation indicators for more robust trading strategies
Keep exploring
What we’ve verified
Access, alerts and repainting behaviour have not been independently verified for this indicator. Check the creator’s current publication and settings.
General descriptions and classifications are recovered research. Verified details above identify the specific checks we have completed. Check the creator’s current publication for later changes.