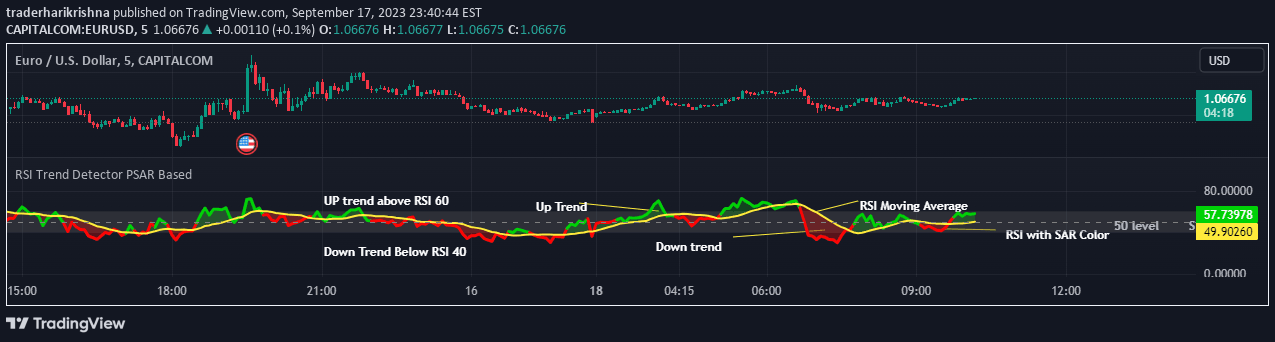
A multi-RSI plotting technique that allows customization of five different RSI indicators with varying parameters like source, length, timeframe, color, and visual representation.
Explore complementary indicator rolesHow it works
This advanced RSI plotting method enables traders to simultaneously display five different RSI indicators with unique configurations. Users can customize each RSI by selecting different source data, length periods, and timeframes.
The visualization allows for varied line styles, including standard lines or arrows, with adjustable width and color schemes. Color coding helps quickly identify RSI zones: above sell limit, between 50 and sell limit, between buy and sell limits, and below buy limit
Why it may be useful
Customizable RSI visualization provides traders with a comprehensive momentum analysis tool. By displaying multiple RSI indicators simultaneously, traders can gain deeper insights into market momentum across different settings.
The color-coded approach enables quick visual interpretation of market conditions, helping traders identify potential trend reversals or momentum shifts. Enhanced flexibility allows for personalized analysis that can adapt to various trading strategies and market conditions
When to explore it
This multi-RSI approach works best when analyzing markets with complex momentum dynamics. Traders can utilize it during trending and ranging markets to identify potential entry and exit points.
It is particularly useful for comparing RSI behavior across different timeframes and sources. The technique is valuable for traders seeking a more nuanced understanding of market momentum beyond traditional single-indicator analysis
Keep exploring
What we’ve verified
Access, alerts and repainting behaviour have not been independently verified for this indicator. Check the creator’s current publication and settings.
General descriptions and classifications are recovered research. Verified details above identify the specific checks we have completed. Check the creator’s current publication for later changes.