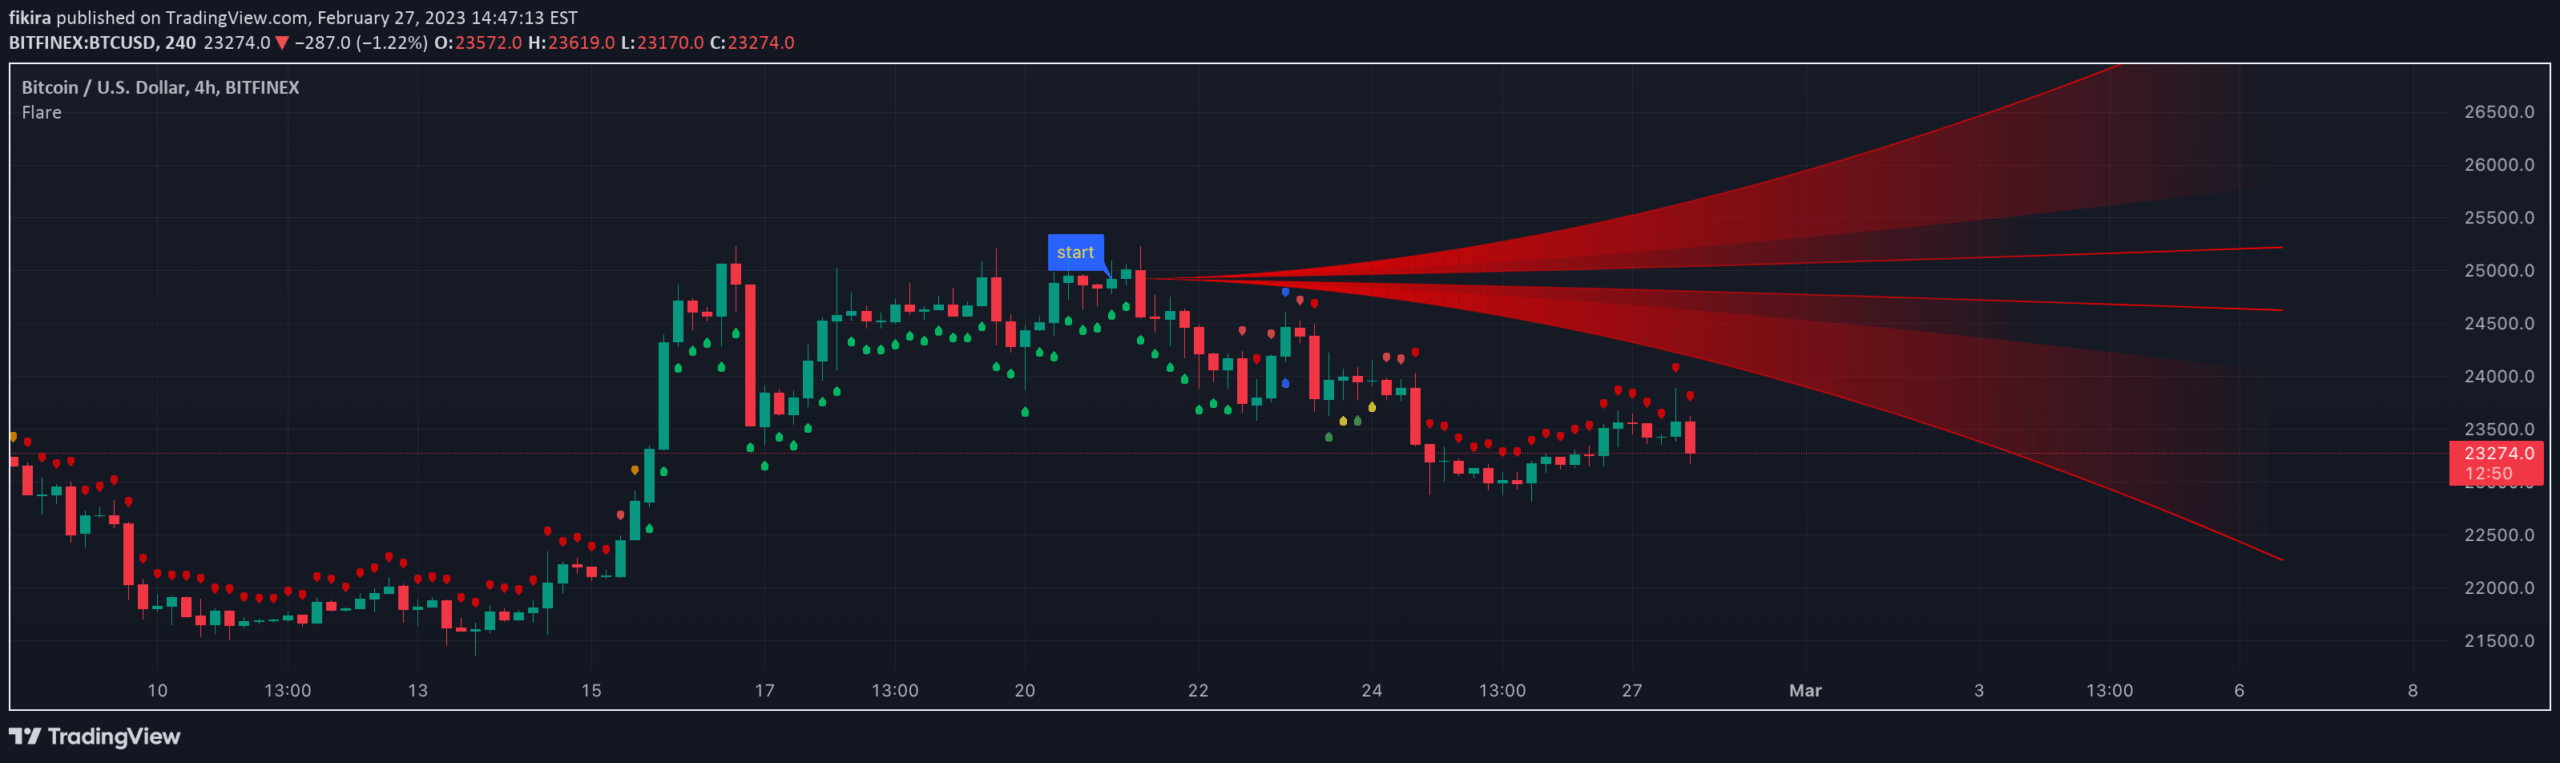
A Pine Script method demonstrating a custom Flare indicator that analyzes price positioning relative to a historical point, using color-coded visual signals to indicate market zones.
Explore complementary indicator rolesHow it works
The Flare signal works by identifying a specific historical point on the chart, typically the close price from a previous bar, and creating a dynamic visual representation of market positioning. It generates a multi-line structure that divides the price action into different zones, allowing traders to quickly assess the current market context relative to this historical reference point.
The indicator calculates the current close's location within the Flare structure, categorizing it into different directional zones such as neutral, bullish, or bearish. By using color-coded plotshapes and line fills, the signal provides an intuitive visual method for understanding price movement and potential market sentiment.
Why it may be useful
This signal provides traders with a unique visual tool for understanding price dynamics and market positioning beyond traditional indicators. By creating a dynamic, color-coded representation of price movement, it helps traders quickly interpret market context and potential trend changes without relying solely on numerical calculations.
The Flare indicator's strength lies in its ability to transform complex price relationships into an easily digestible visual format. Traders can rapidly assess market zones, identify potential trend shifts, and make more informed decisions about entry and exit points based on the indicator's color-coded signals.
When to explore it
The Flare signal is most effective in markets with clear directional movements and during periods of moderate to high volatility. It works best for traders who prefer visual indicators that provide immediate insights into market positioning and potential trend changes. Traders can utilize this signal across various timeframes, particularly in intraday and short-term trading scenarios.
The indicator is particularly useful when combined with other technical analysis tools, helping to confirm trend strength and potential reversal points. Traders should pay special attention to color changes and plotshape locations, which can serve as early warning signs of potential market shifts or continuation patterns.
Keep exploring
What we’ve verified
Access, alerts and repainting behaviour have not been independently verified for this indicator. Check the creator’s current publication and settings.
General descriptions and classifications are recovered research. Verified details above identify the specific checks we have completed. Check the creator’s current publication for later changes.