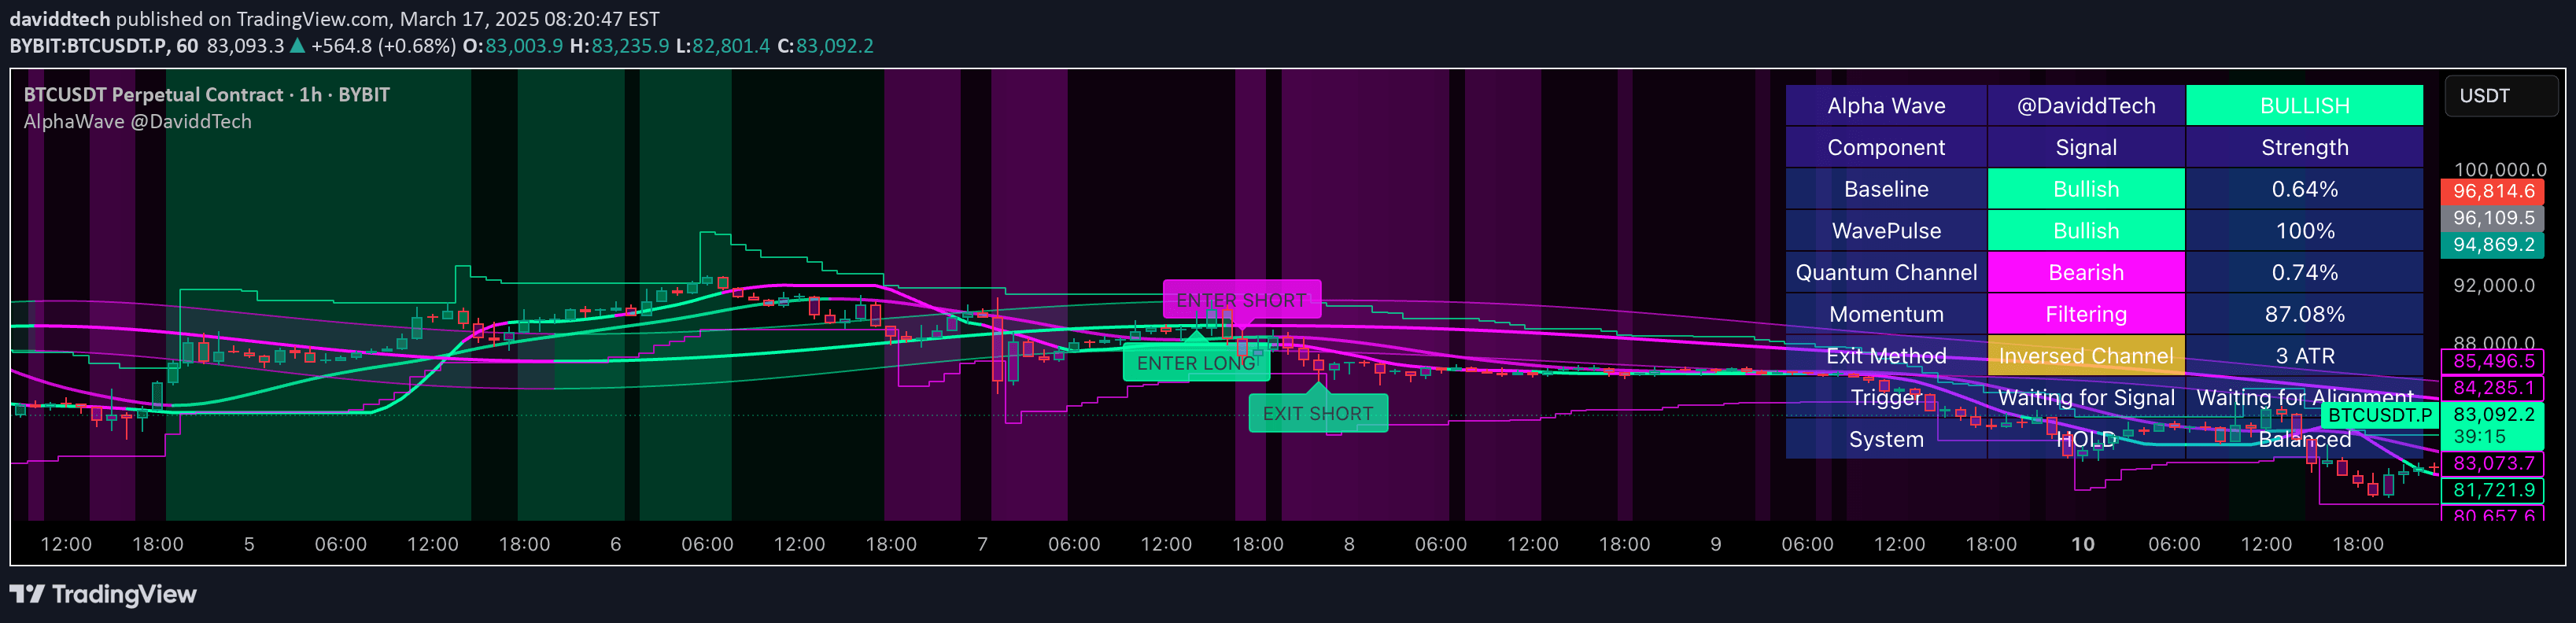
A versatile TradingView indicator that analyzes price trends, compares symbols, and provides technical indicators to help traders make informed decisions across multiple market conditions.
Explore complementary indicator rolesHow it works
The Hull Trend and Compare script generates trend analysis through multiple calculation modes including Normal, Linear, and Heikin-Ashi chart representations. It uses Hull Moving Average (HullMA) to track price trends, plotting the average and generating color-coded background signals based on price relationship.
The indicator simultaneously compares the selected symbol with another symbol, allowing flexible calculation methods for price points. It incorporates technical indicators like Stochastic Momentum, RSI, and MACD to provide comprehensive trend analysis and comparative market insights.
Why it may be useful
This indicator offers traders a multi-dimensional view of market trends by combining trend analysis, symbol comparison, and technical indicators in a single comprehensive tool. By providing visual and numerical representations of market dynamics, traders can quickly assess potential trading opportunities and market sentiment.
The flexibility of mode selection, symbol comparison, and technical indicator display enables traders to customize their analysis approach. The script's ability to generate buy and sell signals while presenting comparative data helps traders make more informed and nuanced trading decisions.
When to explore it
The Hull Trend and Compare script is most effective in markets with clear trending characteristics, where price movements exhibit consistent directional momentum. It works well across various timeframes, making it suitable for scalpers, day traders, and swing traders seeking comprehensive market analysis.
Traders should utilize this indicator when they want to compare multiple symbols, assess trend strength, and gain insights through multiple technical indicators. It is particularly useful during periods of market transition, helping traders identify potential trend reversals and comparative market behaviors.
Keep exploring
What we’ve verified
Access, alerts and repainting behaviour have not been independently verified for this indicator. Check the creator’s current publication and settings.
General descriptions and classifications are recovered research. Verified details above identify the specific checks we have completed. Check the creator’s current publication for later changes.