
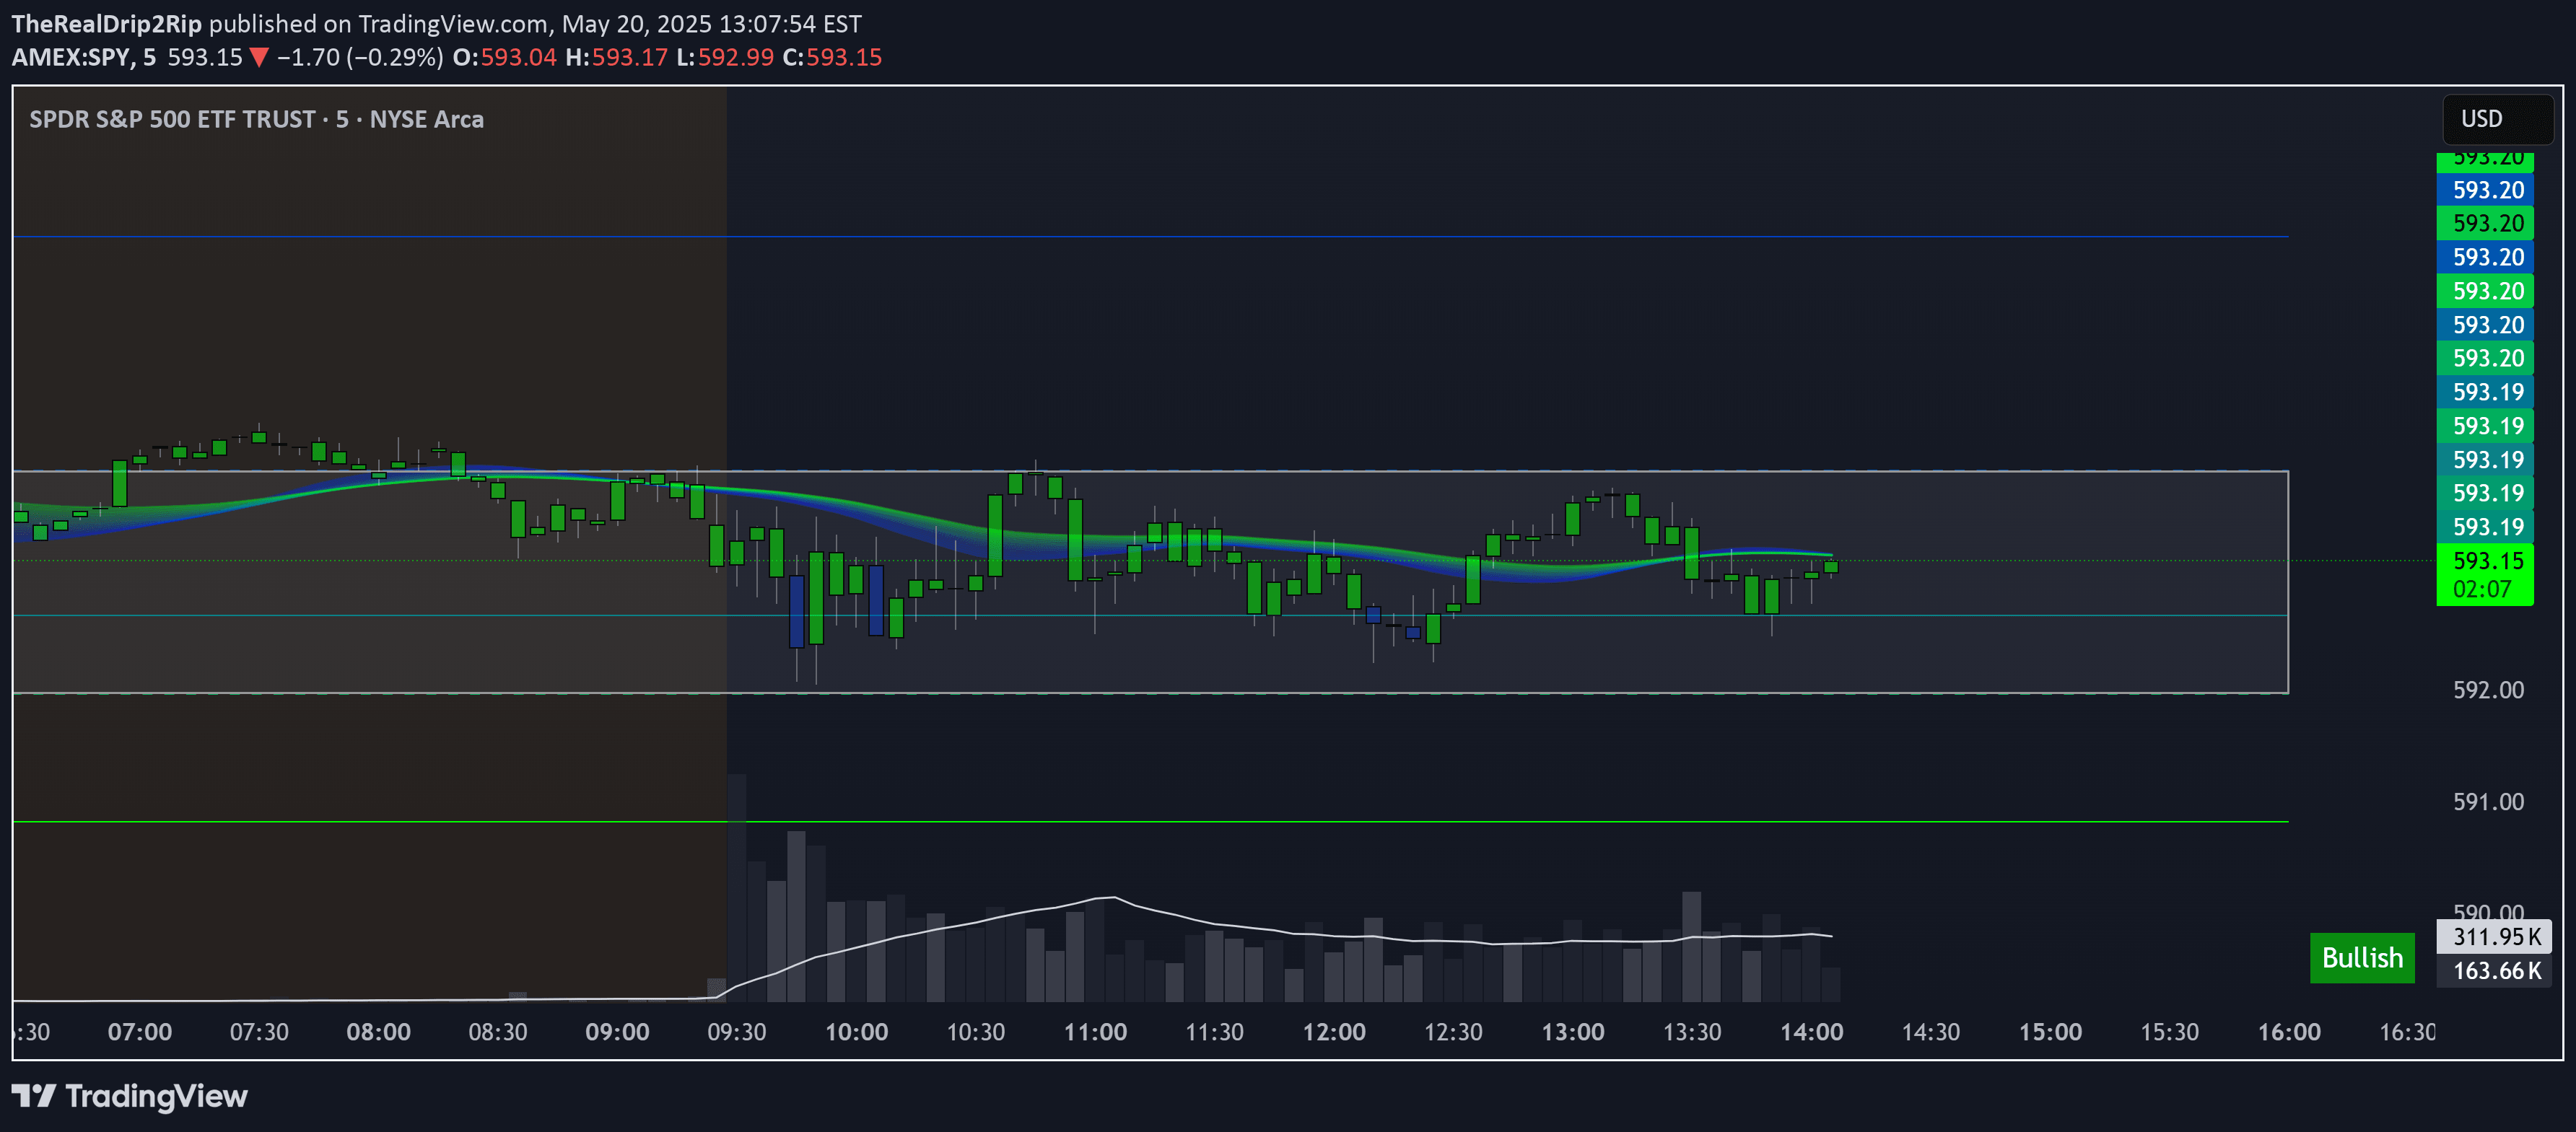
A dynamic trading tool combining daily pivot levels with EMA ribbons to help traders identify market structure, momentum, and key decision zones with visual clarity.
Explore complementary indicator rolesHow it works
The indicator calculates daily pivot points using the previous day's OHLC data, generating support and resistance levels automatically. It plots these key levels alongside a 20-EMA ribbon, with each EMA incrementally smoothed and color-coded from blue to green to represent short to long-term trend alignment.
A unique cumulative EMA is created by dynamically weighting each EMA based on its historical predictive accuracy. This adaptive approach allows traders to see trend momentum while reducing noise, with lower-error EMAs receiving higher weights that are normalized to create a more intelligent moving average.
Why it may be useful
By combining multiple analytical techniques, this tool provides traders with a comprehensive visual representation of market structure and momentum. The pivot levels offer clear reference points for potential support and resistance, while the EMA ribbon helps traders quickly understand trend direction and strength.
The adaptive weighting of the cumulative EMA introduces an intelligent element to trend analysis, allowing traders to benefit from a more nuanced approach to market movement. This method helps reduce false signals and provides a more reliable interpretation of market dynamics.
When to explore it
This indicator is most effective for traders seeking clear, visual insights into market structure during intraday and swing trading scenarios. It works best in markets with clear directional movement, where pivot points and trend momentum can provide reliable trading signals.
Traders should use this tool to identify potential entry and exit points, particularly when price breaks above resistance or below support levels. The no-trade zone and EMA ribbon help traders avoid choppy market conditions and confirm trend alignment before making trading decisions.
Keep exploring
What we’ve verified
Access, alerts and repainting behaviour have not been independently verified for this indicator. Check the creator’s current publication and settings.
General descriptions and classifications are recovered research. Verified details above identify the specific checks we have completed. Check the creator’s current publication for later changes.


