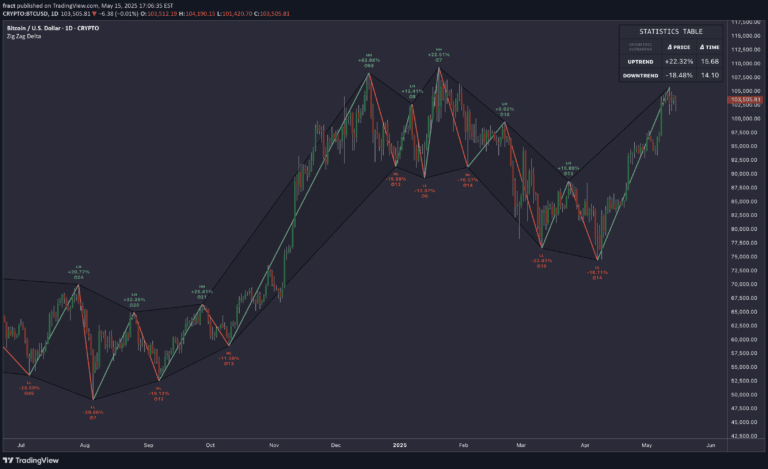
A Bitcoin-specific price prediction indicator using Stock-to-Flow model that estimates expected price ranges by analyzing Bitcoin's supply dynamics and incorporating error bands.
Explore complementary indicator rolesHow it works
The Limited Growth Stock-to-Flow (LG-S2F) indicator analyzes Bitcoin's price by calculating the relationship between its circulating supply and newly produced supply. It uses a specialized formula incorporating coefficients and block height data to derive an expected price projection.
The indicator generates error bands around the main price line to represent potential price variations and model uncertainties. These error bands help traders visualize potential overbought and oversold conditions, providing a comprehensive view of potential price movements within a probabilistic framework.
Why it may be useful
The LG-S2F indicator offers traders a sophisticated analytical approach to understanding Bitcoin's price potential by leveraging the Stock-to-Flow model's scarcity-based valuation methodology. By quantifying Bitcoin's unique supply characteristics, the indicator provides insights beyond traditional technical analysis approaches.
This tool is particularly valuable for cryptocurrency investors seeking a data-driven perspective on Bitcoin's potential price trajectory. The incorporation of error bands allows traders to assess price expectations with a nuanced understanding of potential variations and model uncertainties.
When to explore it
The LG-S2F indicator is most effective for longer-term investment strategies focused on Bitcoin's macro price trends and potential future valuations. Traders can utilize this indicator when seeking a comprehensive view of Bitcoin's price potential based on its supply dynamics and scarcity model.
Ideal usage includes identifying potential long-term entry and exit points, especially when the price approaches the lower or upper error bands. Traders should combine this indicator with additional fundamental and technical analysis to make more informed investment decisions.
Keep exploring
What we’ve verified
Access, alerts and repainting behaviour have not been independently verified for this indicator. Check the creator’s current publication and settings.
General descriptions and classifications are recovered research. Verified details above identify the specific checks we have completed. Check the creator’s current publication for later changes.