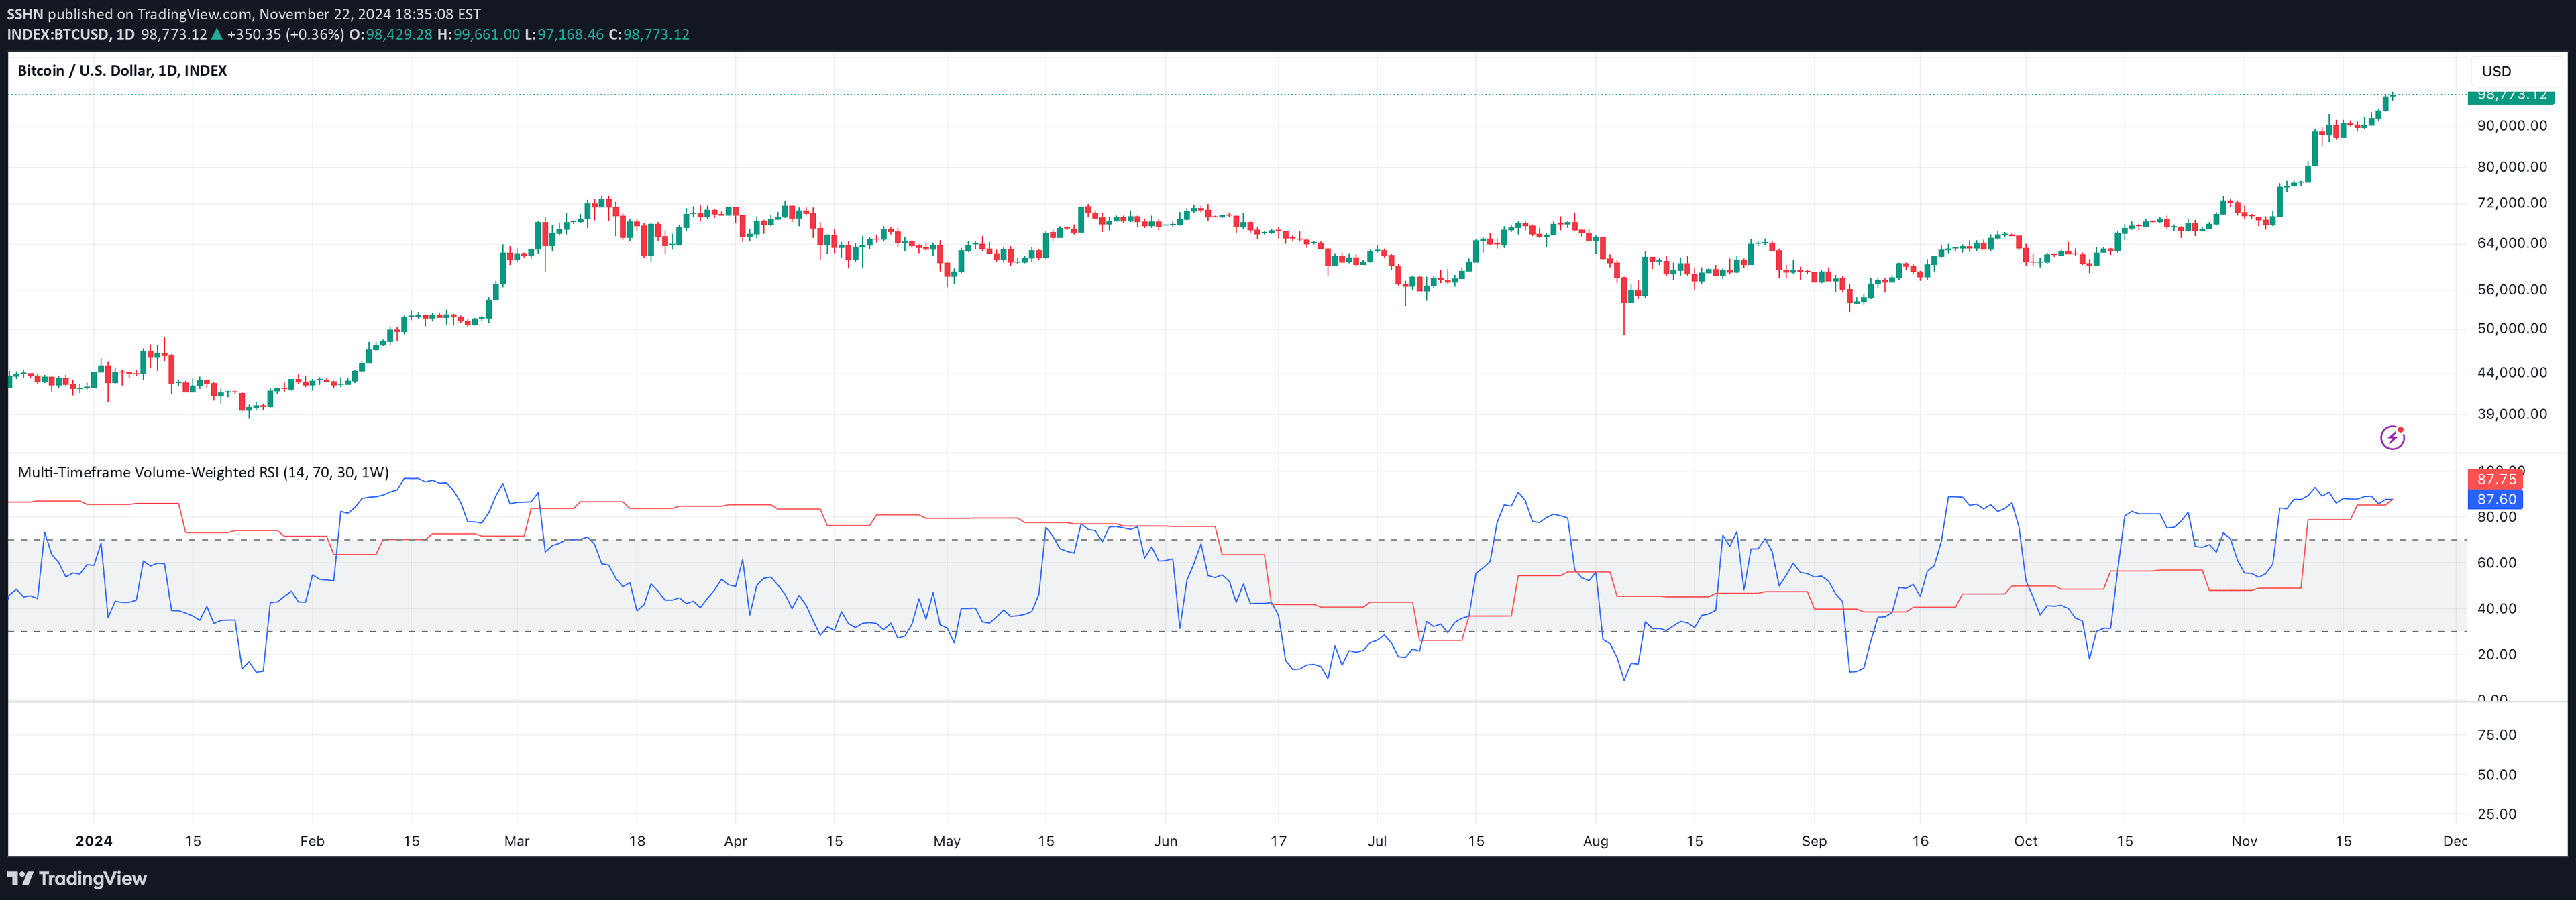
A trading indicator that visualizes market liquidity zones and uses volume-weighted RSI to enhance momentum analysis, helping traders identify potential price reversals and trend strengths.
Explore complementary indicator rolesHow it works
The Liquidity Heatmap Indicator with Volume-Weighted RSI operates by analyzing price zones and incorporating trading volume into the Relative Strength Index calculation. It creates a color-coded heatmap representing market liquidity levels, with different colors indicating varying degrees of potential support and resistance.
The volume-weighted component modifies the traditional RSI by factoring in trading volume, which helps reduce false signals and provides a more nuanced view of market momentum. By integrating volume data, the indicator can more accurately assess the strength of price movements and potential trend reversals.
Why it may be useful
The Liquidity Heatmap Indicator with Volume-Weighted RSI provides traders with a sophisticated tool for understanding market dynamics beyond traditional price analysis. By visualizing liquidity zones and incorporating volume, traders can make more informed decisions about potential entry and exit points.
The indicator's unique approach allows traders to see not just price movement, but the underlying market structure and momentum. This deeper insight helps traders identify high-probability trading opportunities and better manage risk by understanding where significant market activity is concentrated.
When to explore it
The Liquidity Heatmap Indicator with Volume-Weighted RSI is most effective in markets with significant trading volume and clear price trends. It works particularly well in liquid markets like forex, major stock indices, and high-volume cryptocurrency pairs where volume data provides meaningful insights.
Traders should use this indicator during periods of active market movement, such as during economic announcements, earnings reports, or when significant market sentiment shifts are occurring. It is especially useful when combined with other technical analysis tools to confirm signals and validate potential trading strategies.
Keep exploring
What we’ve verified
Access, alerts and repainting behaviour have not been independently verified for this indicator. Check the creator’s current publication and settings.
General descriptions and classifications are recovered research. Verified details above identify the specific checks we have completed. Check the creator’s current publication for later changes.