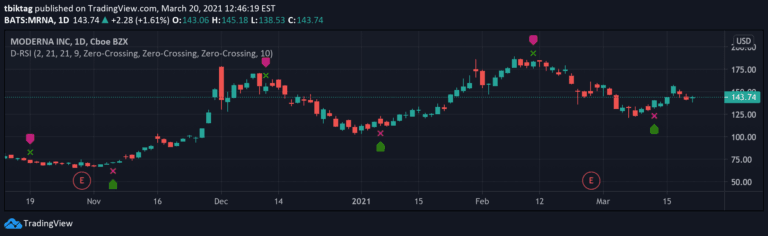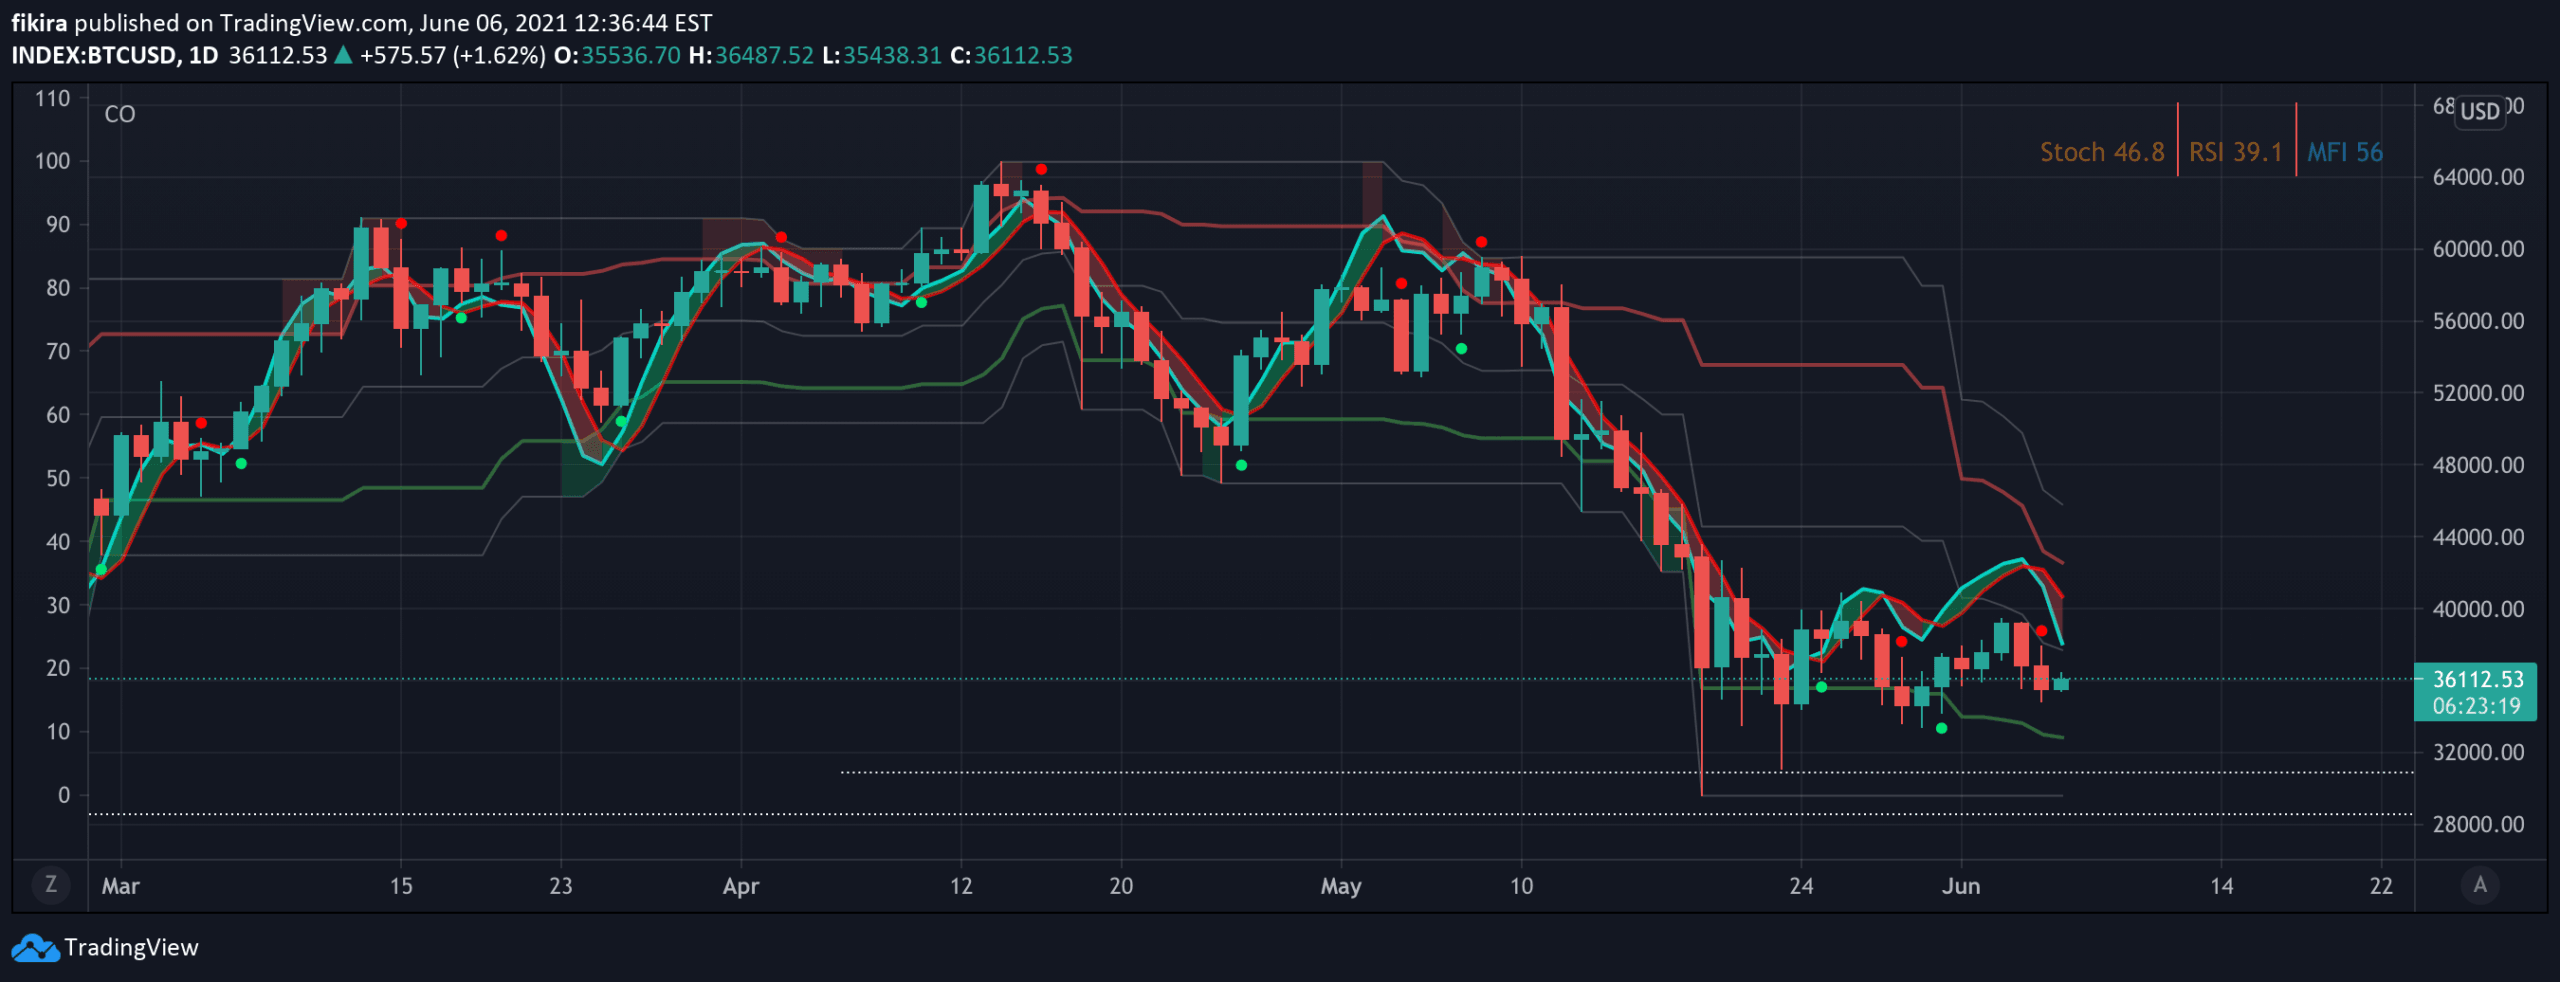
A custom oscillator with dynamic range mapping between lowest and highest price levels, providing enhanced visualization of momentum signals directly on the price chart.
Explore complementary indicator rolesHow it works
This oscillator plots directly on the price chart, using dynamic range mapping instead of fixed 0-100 levels. It calculates oscillator values based on the lowest and highest price levels within a specified length.
The indicator creates overbought, oversold, and middle lines derived from these dynamic ranges. Unlike traditional oscillators, this approach allows traders to simultaneously view price candle movements alongside the oscillator's signals, providing a more integrated analysis of market momentum
Why it may be useful
The oscillator offers traders a more nuanced view of market momentum by adapting to actual price dynamics. By mapping oscillator levels to real price ranges, it provides more contextual information about potential trend reversals and market conditions.
The integrated chart design allows for immediate visual correlation between price action and momentum signals. This approach can help traders identify subtle shifts in market sentiment and make more informed trading decisions based on a comprehensive view of price movement
When to explore it
This oscillator works best in markets with clear trending or ranging conditions. It is particularly useful for traders seeking to identify potential trend reversals, entry and exit points, and market momentum shifts.
The indicator is most effective when applied to liquid markets with consistent price movements. Traders should combine this oscillator with other technical analysis tools to confirm signals and reduce false positives. It is especially valuable for swing and day traders who require precise momentum analysis
Keep exploring
What we’ve verified
Access, alerts and repainting behaviour have not been independently verified for this indicator. Check the creator’s current publication and settings.
General descriptions and classifications are recovered research. Verified details above identify the specific checks we have completed. Check the creator’s current publication for later changes.