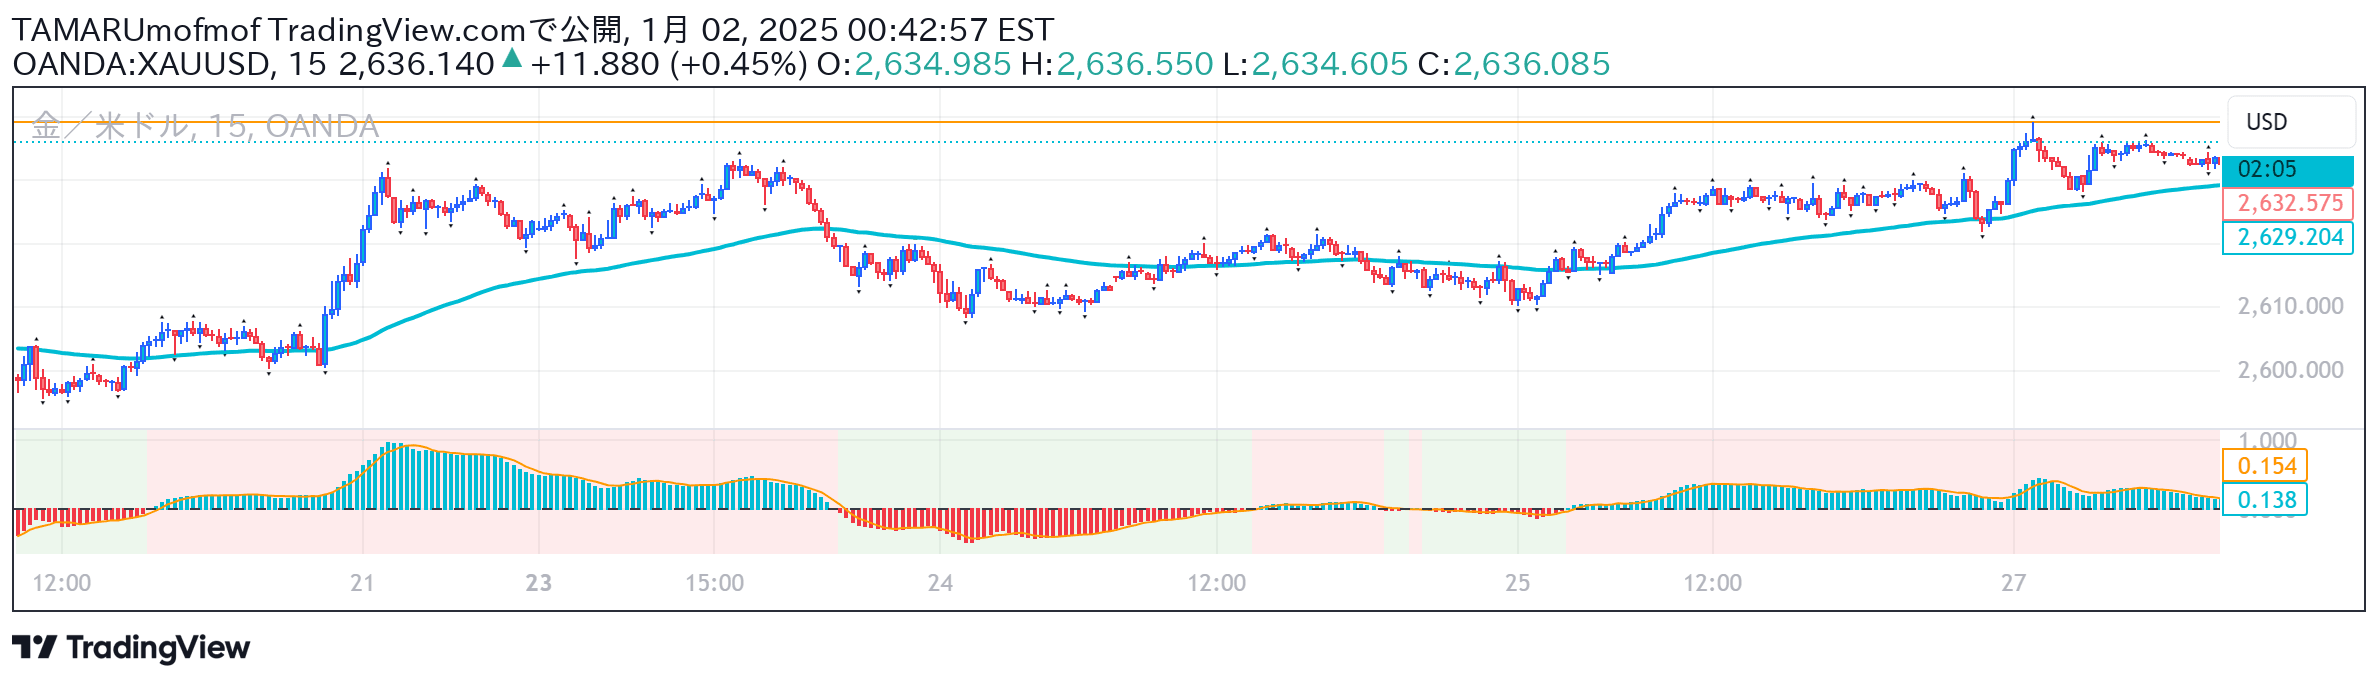
A momentum indicator measuring net price displacement against total price activity, using normalized values between -1 and +1 to assess directional strength and trend momentum.
Explore complementary indicator rolesHow it works
The Directionality Oscillator calculates net price displacement by comparing today's closing price to the close from a specified look-back period. It divides this difference by the sum of absolute bar-to-bar price moves, generating a normalized value between -1 and +1.
To reduce short-term noise, the indicator applies a five-bar simple moving average to the normalized value. A color gradient from red (-1) to gray (0) to green (+1) visually represents the directional momentum, making it easy to interpret the indicator's signals.
Why it may be useful
This indicator provides traders with a clear, normalized view of price momentum by filtering out sideways market noise and focusing on sustained directional movement. By presenting directional strength through a standardized scale, it helps traders quickly assess whether bullish or bearish forces are dominant.
The color-coded visualization and threshold lines make it simple to identify potential trend changes, momentum shifts, and zones of extreme directional strength, enabling more informed trading decisions across different market conditions.
When to explore it
The Directionality Oscillator is most effective in trending markets where clear directional movement is present. Traders can use it to confirm existing trends, identify potential reversals, and assess the strength of price momentum across various timeframes.
It works particularly well when combined with other technical analysis tools, such as price action indicators or volume analysis, to validate signals and increase the probability of successful trades. The oscillator is versatile enough to be applied in scalping, day trading, and swing trading strategies.
Keep exploring
What we’ve verified
Access, alerts and repainting behaviour have not been independently verified for this indicator. Check the creator’s current publication and settings.
General descriptions and classifications are recovered research. Verified details above identify the specific checks we have completed. Check the creator’s current publication for later changes.