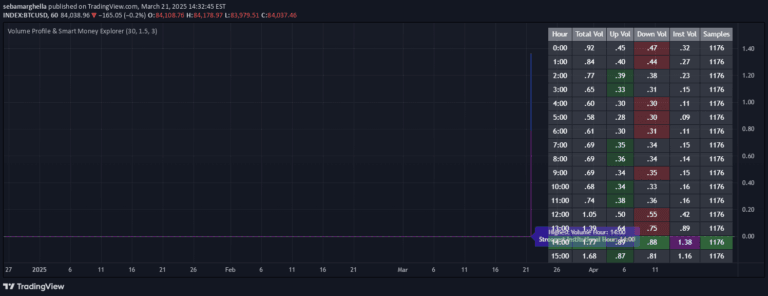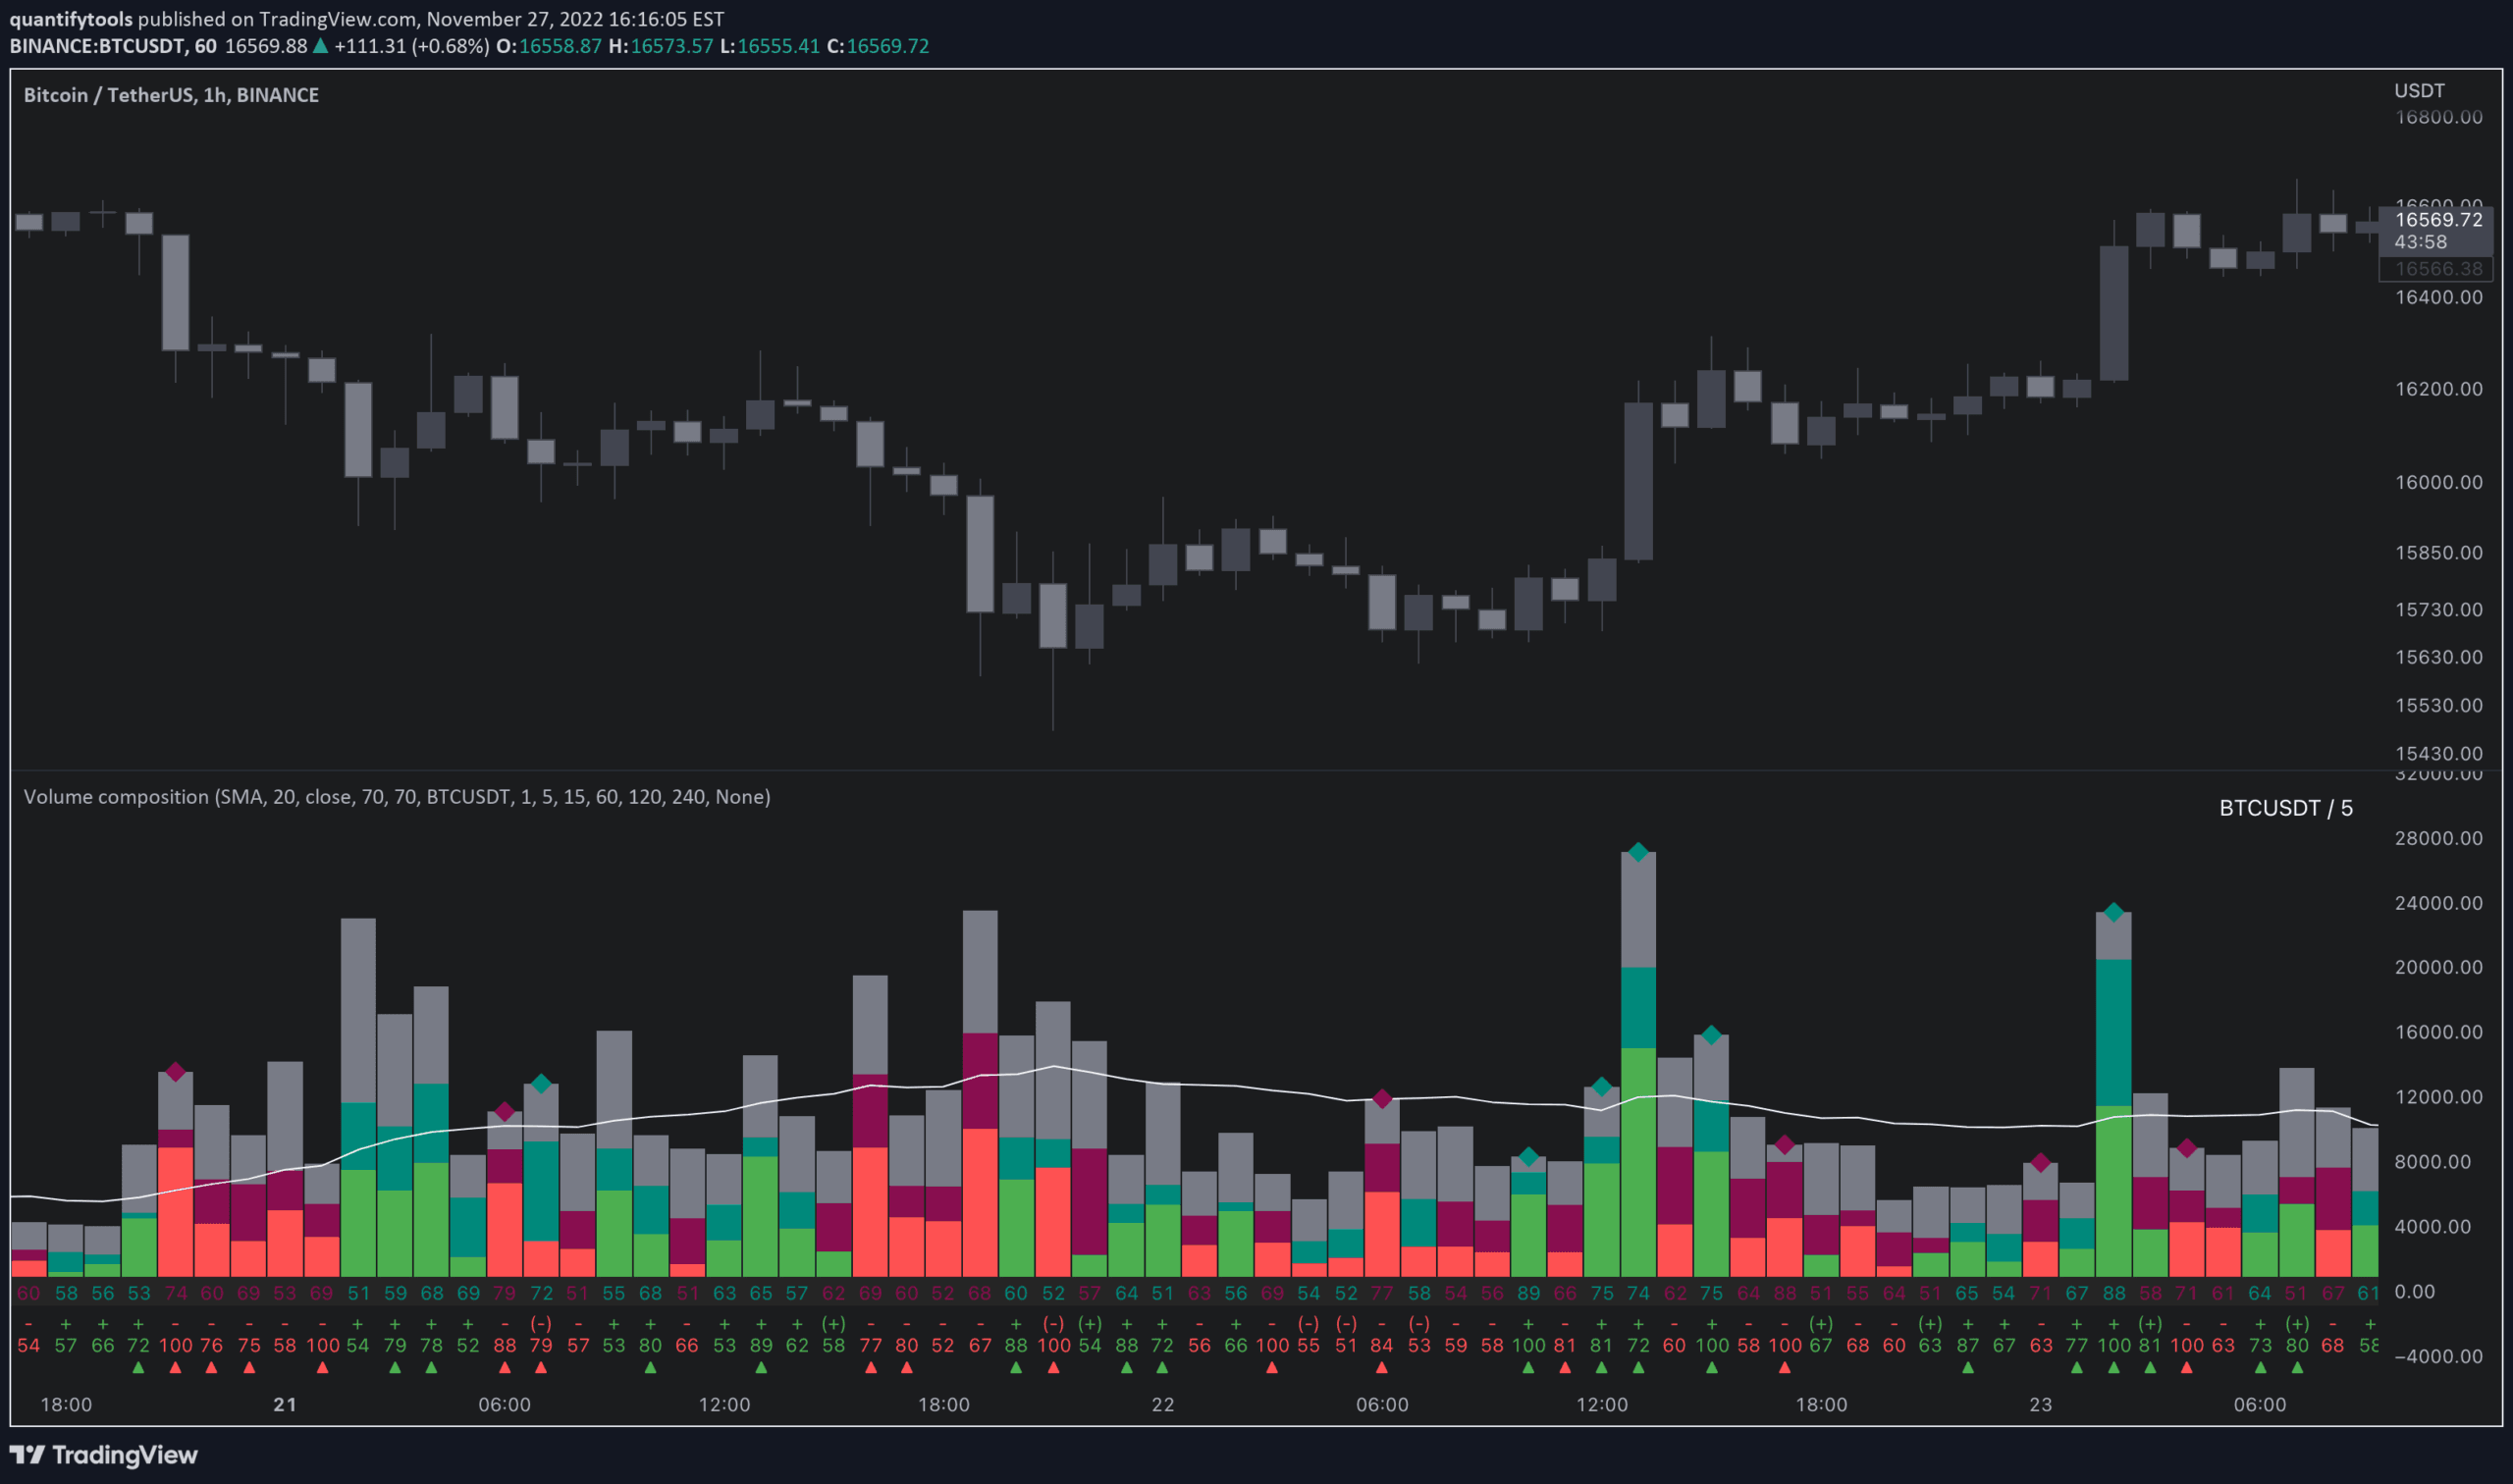
Volume composition indicator that breaks down trading volume into buy, sell, passive, and active components to provide deeper insights into market liquidity and potential price movements.
Explore complementary indicator rolesHow it works
The indicator analyzes volume composition by breaking down total volume into buy and sell components, further distinguishing between passive and active volume. It automatically adjusts to lower timeframes based on the chart's timeframe, from 1-minute to 4-hour intervals.
The analysis classifies volume as buy or sell based on price movements, considering volume increases or decreases relative to previous bars. It calculates dominating volume percentages, highlighting the dominant side of trading activity and the intensity of volume movements
Why it may be useful
Volume composition provides critical insights into market dynamics that simple volume indicators miss. It reveals the underlying strength of price movements by showing whether volume is supporting or potentially reversing a trend.
Traders can identify areas of market liquidity, potential trapped participants, and moments of indecision. The detailed breakdown helps distinguish between passive price movements and aggressive trading activity, offering a more nuanced understanding of market sentiment and potential future price direction
When to explore it
This indicator works best during periods of significant market movement or potential trend changes. It is particularly useful when identifying liquidity zones, analyzing volume spikes, and detecting divergences between dominating volume and active volume.
Traders should pay special attention during breakouts, trend reversals, and consolidation periods. It provides maximum value in markets with clear volume characteristics, such as stocks, futures, and forex during key economic events or market sessions with high trading activity
Keep exploring
What we’ve verified
Access, alerts and repainting behaviour have not been independently verified for this indicator. Check the creator’s current publication and settings.
General descriptions and classifications are recovered research. Verified details above identify the specific checks we have completed. Check the creator’s current publication for later changes.