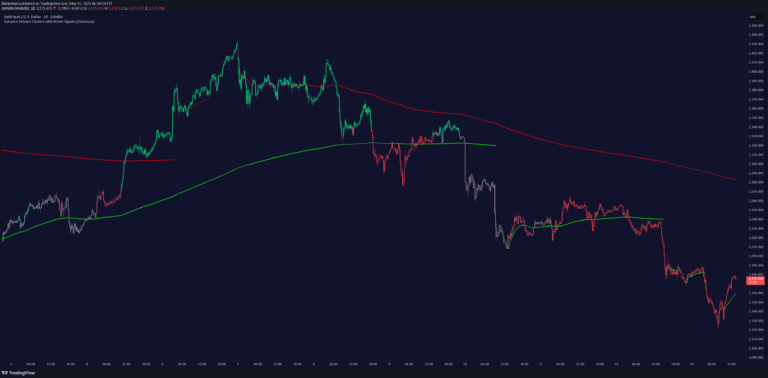
Volume Delta is an advanced indicator that analyzes trading volumes, revealing buy-sell activities and market momentum through color-coded candlestick visualizations.
Explore complementary indicator rolesHow it works
Volume Delta operates by calculating the percentage of buying and selling volumes within each candlestick, providing a visual representation of market activity. It uses a 100% area between the open and close prices, filling this space with colors that correspond to the predominant volume type, allowing traders to quickly understand market dynamics.
The indicator also incorporates Net volume calculations, which determine the difference between trades executed at upticks and downticks. By using 12 and 26-day Exponential Moving Averages (EMAs) with a Volume Confirmation Length of 6, the indicator can highlight crossovers with triangular markers when volume conditions are met.
Why it may be useful
Volume Delta provides traders with critical insights into market sentiment by transforming raw volume data into an easily interpretable visual format. It helps traders understand the underlying strength of price movements by revealing the balance between buying and selling pressures, which can be more informative than price action alone.
By color-coding volume distribution and showing the relative strength of buy and sell activities, the indicator allows traders to make more informed decisions. The integration of EMA crossovers with volume confirmation adds an extra layer of validation, helping traders distinguish between potentially significant market movements and less reliable signals.
When to explore it
Volume Delta is most effective in markets with significant trading activity where volume can provide meaningful insights into price movements. It works particularly well for traders seeking to confirm trend strength, identify potential reversals, and understand the underlying momentum of financial instruments.
The indicator is especially useful during periods of market volatility, such as news events, earnings releases, or significant economic announcements. Traders can leverage Volume Delta to assess market sentiment, validate trend changes, and make more precise entry and exit decisions based on volume dynamics.
Keep exploring
What we’ve verified
Access, alerts and repainting behaviour have not been independently verified for this indicator. Check the creator’s current publication and settings.
General descriptions and classifications are recovered research. Verified details above identify the specific checks we have completed. Check the creator’s current publication for later changes.