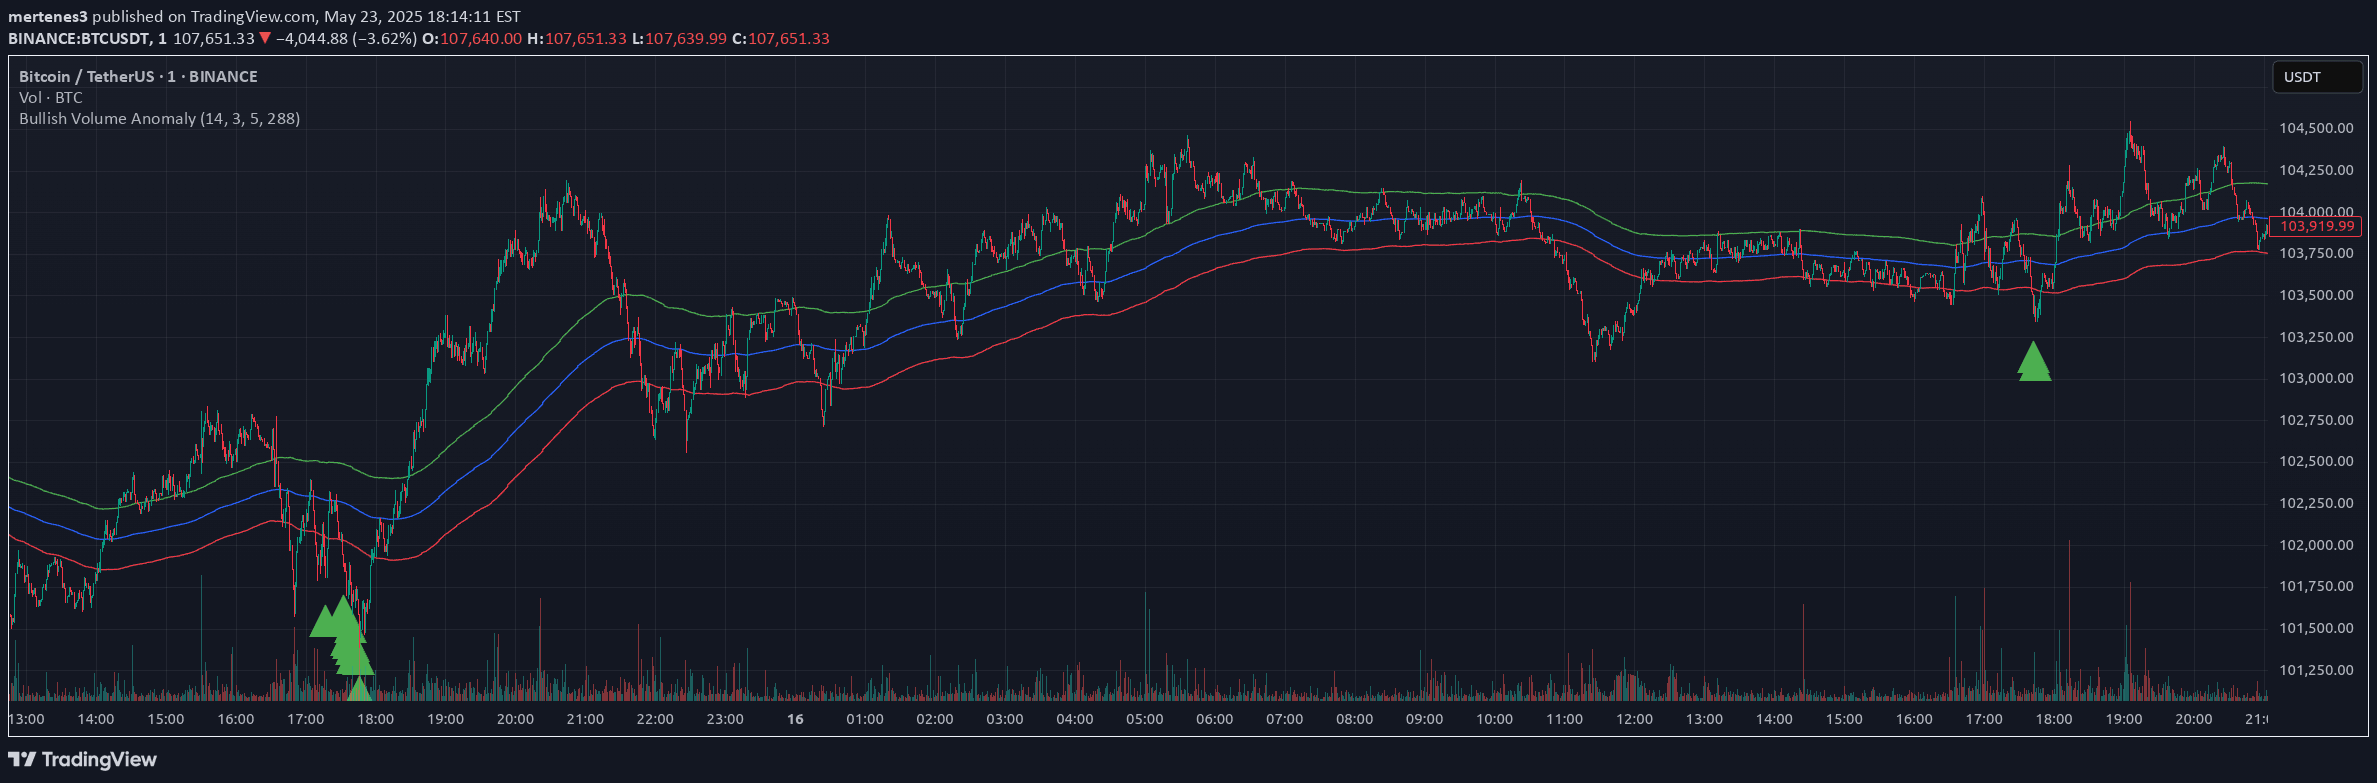
An advanced volume analysis tool that visualizes supply and demand dynamics by tracking buyer and seller strength within candlesticks, helping traders understand market momentum and potential trend reversals.
Explore complementary indicator rolesHow it works
The indicator calculates supply and demand strength by analyzing the ratio of buying and selling volumes within each candlestick. It uses lower timeframe or real-time data to generate color-coded bars representing market activity, with specific metrics like peak delta, lowest delta, and net delta.
By integrating volume data directly into candlestick visualization, traders can quickly interpret market dynamics without relying on separate volume indicators. The tool marks price levels with the highest trade volume as black lines, providing additional insights into potential support and resistance zones.
Why it may be useful
Understanding supply and demand dynamics is crucial for successful trading, as these forces directly influence price movements and market trends. By providing a clear, visual representation of buyer and seller strength, this indicator helps traders make more informed decisions about market entry and exit points.
The tool's ability to translate complex volume metrics into an intuitive format allows traders to quickly assess market sentiment and potential trend reversals. Its comprehensive approach to volume analysis offers unprecedented clarity into market behavior, making it valuable for both novice and professional traders.
When to explore it
This indicator is most effective in markets with significant volume and clear trending characteristics, such as forex, stocks, and cryptocurrency trading. It works best when traders want to confirm trend strength, identify potential reversal points, and understand the underlying market dynamics driving price action.
Traders should utilize this tool during periods of market volatility and when seeking to validate trend continuations or potential shifts. Its flexibility in timeframe selection and calculation methods makes it adaptable to various trading strategies and market conditions.
Keep exploring
What we’ve verified
Access, alerts and repainting behaviour have not been independently verified for this indicator. Check the creator’s current publication and settings.
General descriptions and classifications are recovered research. Verified details above identify the specific checks we have completed. Check the creator’s current publication for later changes.