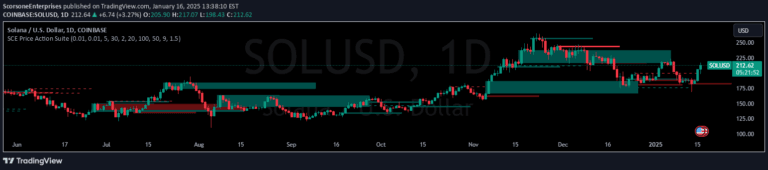
VWAP indicator with dynamic bands combined with engulfing candlestick pattern detection, providing visual signals and alerts for potential trend reversals and trading opportunities.
Explore complementary indicator rolesHow it works
The VWAP indicator calculates the volume-weighted average price by multiplying price by volume and dividing by total volume traded during a specific period. It generates up to three bands around the central VWAP line using either standard deviation or percentage deviation, helping traders understand price movement relative to the average.
Simultaneously, the engulfing candlestick pattern detector analyzes consecutive candles to identify potential trend reversals. By comparing current and previous candle opens and closes, it determines bullish or bearish engulfing patterns and marks them with colored triangles, providing clear visual signals for potential trading opportunities.
Why it may be useful
VWAP helps traders understand the true average price weighted by volume, offering insights beyond simple price movement. By incorporating bands around the VWAP, traders can quickly identify potential overbought or oversold conditions and assess market sentiment with greater precision.
The engulfing pattern detection adds another layer of analysis by highlighting potential trend reversal points. These candlestick patterns are powerful indicators of shifting market dynamics, allowing traders to anticipate potential trend changes and make more informed trading decisions based on price action.
When to explore it
This indicator works best on intraday and swing trading timeframes, particularly on 5-minute, 15-minute, 1-hour charts for intraday trading, and 4-hour or daily charts for swing trading. It is particularly effective in markets with consistent volume and clear price trends.
Traders should use this indicator in conjunction with other technical analysis tools to confirm signals and reduce false positives. It is especially useful in volatile markets where understanding volume-weighted price movement and rapid trend reversals can provide a competitive edge in decision-making.
Keep exploring
What we’ve verified
Access, alerts and repainting behaviour have not been independently verified for this indicator. Check the creator’s current publication and settings.
General descriptions and classifications are recovered research. Verified details above identify the specific checks we have completed. Check the creator’s current publication for later changes.