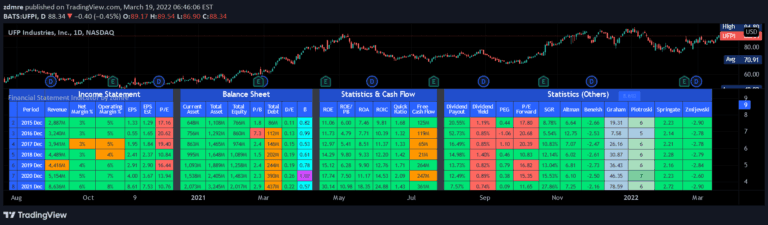
A comprehensive financial analysis radar chart that evaluates multiple key performance indicators to assess a company's financial health and investment potential.
Explore complementary indicator rolesHow it works
The radar chart scoring system evaluates seven critical financial metrics to provide a holistic view of a company's financial performance. Each metric is scored based on predefined ranges, including debt-to-equity ratio, return on invested capital, return on equity, operating margin, enterprise value to EBITDA, free cash flow, and revenue growth.
The scoring mechanism assigns points from 0 to 100 for each dimension, allowing investors to quickly understand a company's strengths and weaknesses across multiple financial dimensions.
Why it may be useful
This multi-dimensional analysis helps investors make more informed investment decisions by providing a comprehensive snapshot of a company's financial health. It enables quick comparison between different companies and highlights potential strengths and weaknesses in their financial structure.
By breaking down complex financial metrics into an easy-to-understand scoring system, investors can quickly assess a company's performance potential and identify investment opportunities with greater confidence and precision.
When to explore it
The radar chart is most effective when conducting fundamental analysis of potential investment targets, particularly for long-term investors seeking robust and financially stable companies. It is ideal for comparing multiple companies within the same industry or sector.
Investors should use this analysis as part of a comprehensive investment strategy, combining these insights with other research methods, market trends, and individual investment goals to make well-rounded financial decisions.
Keep exploring
What we’ve verified
Access, alerts and repainting behaviour have not been independently verified for this indicator. Check the creator’s current publication and settings.
General descriptions and classifications are recovered research. Verified details above identify the specific checks we have completed. Check the creator’s current publication for later changes.