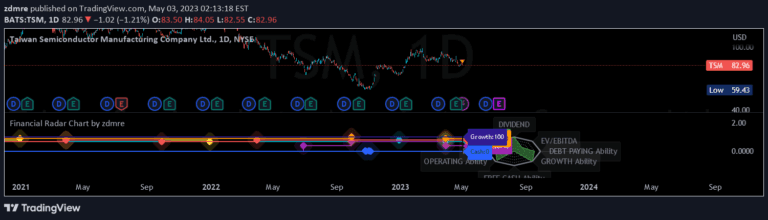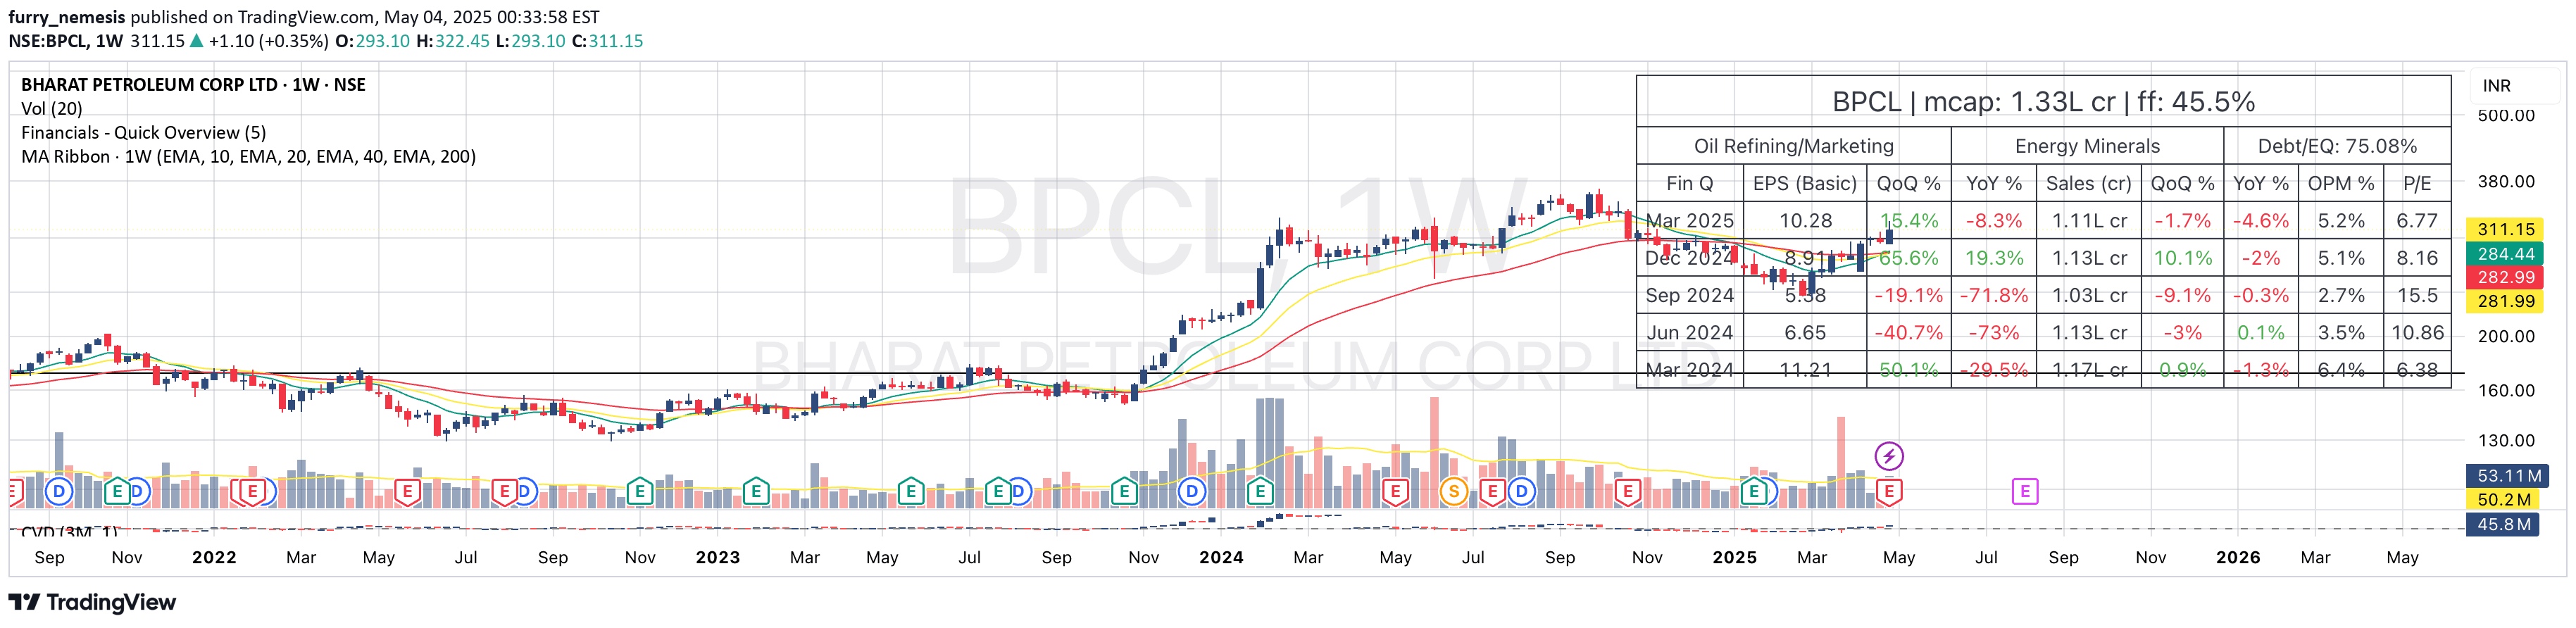
A comprehensive financial indicator that provides traders a quick overview of company performance through key metrics like sector, earnings, growth, and valuation in a chart-based format.
Explore complementary indicator rolesHow it works
The indicator generates a detailed financial table directly on the trading chart, highlighting critical company information and performance metrics. It aggregates data from various financial sources to present a comprehensive snapshot of a company's current status.
By displaying metrics like sector classification, earnings, sales, growth percentages, operating margin, and price-to-earnings ratio, the tool enables traders to quickly assess a company's fundamental health alongside price action.
Why it may be useful
This signal bridges the gap between technical and fundamental analysis by integrating key financial metrics directly into the trading chart. It provides traders with instant insights into a company's performance, allowing for more informed investment decisions without extensive external research.
By presenting complex financial data in an easily digestible format, the indicator empowers traders to make more comprehensive assessments of potential trades, considering both price movement and underlying financial strength.
When to explore it
The indicator is most effective when evaluating stocks within specific sectors or comparing companies with similar market capitalizations. It proves particularly valuable during earnings seasons or when significant market events might impact sector-wide performance.
Traders can leverage this tool when seeking to understand a company's financial context before making trading decisions, especially when transitioning between technical analysis and fundamental investment strategies.
Keep exploring
What we’ve verified
Access, alerts and repainting behaviour have not been independently verified for this indicator. Check the creator’s current publication and settings.
General descriptions and classifications are recovered research. Verified details above identify the specific checks we have completed. Check the creator’s current publication for later changes.