Institutional Activity Index [AlgoAlpha]
An innovative index tracking institutional trading activity by analyzing volume and price range, providing insights into potential market movements without indicating specific direction.
Explore 11,183 indicators. Filter beyond the obvious.
Discover the tools that fit the way you trade.
11,183 tools to explore
An innovative index tracking institutional trading activity by analyzing volume and price range, providing insights into potential market movements without indicating specific direction.
An advanced Bitcoin price prediction model using Stock-to-Flow ratio with nonlinear analysis, offering refined insights into cryptocurrency market dynamics and potential price movements.
A Bitcoin on-chain indicator that analyzes address profits and losses, providing insights into market sentiment through a value score, alpha decay adjustment, and reversal signals.
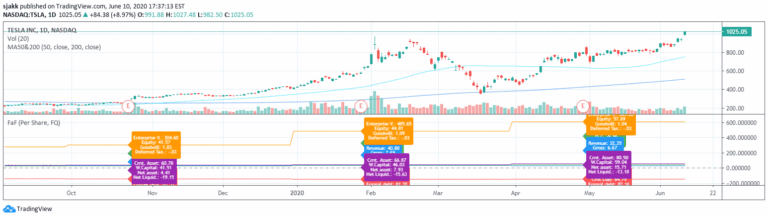
A comprehensive financial health indicator that analyzes quarterly reporting data, displaying trends in debt, cash, and earnings through a unique Pine Script approach for comprehensive market analysis.
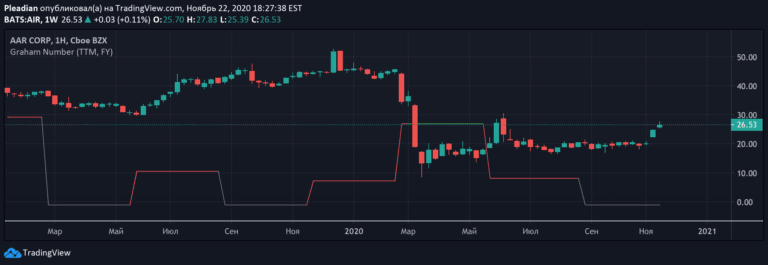
Graham Number is a stock valuation metric that calculates a stock's maximum fair market value by considering earnings per share and book value per share using a specific formula.
CAPE ratio is a long-term valuation measure that smooths earnings over ten years, helping investors assess market valuations and identify potential investment opportunities.
A blockchain-based fundamental analysis indicator that evaluates cryptocurrency market conditions using intrinsic blockchain metrics, offering traders a unique perspective on market trends and potential trading opportunities.
An investment valuation method comparing a company's total assets to its market capitalization to determine whether a security is overvalued or undervalued.
A multi-stock comparative analysis tool that evaluates fundamental performance by comparing year-over-year earnings, sales growth, and P/E ratios across up to 10 stocks simultaneously.
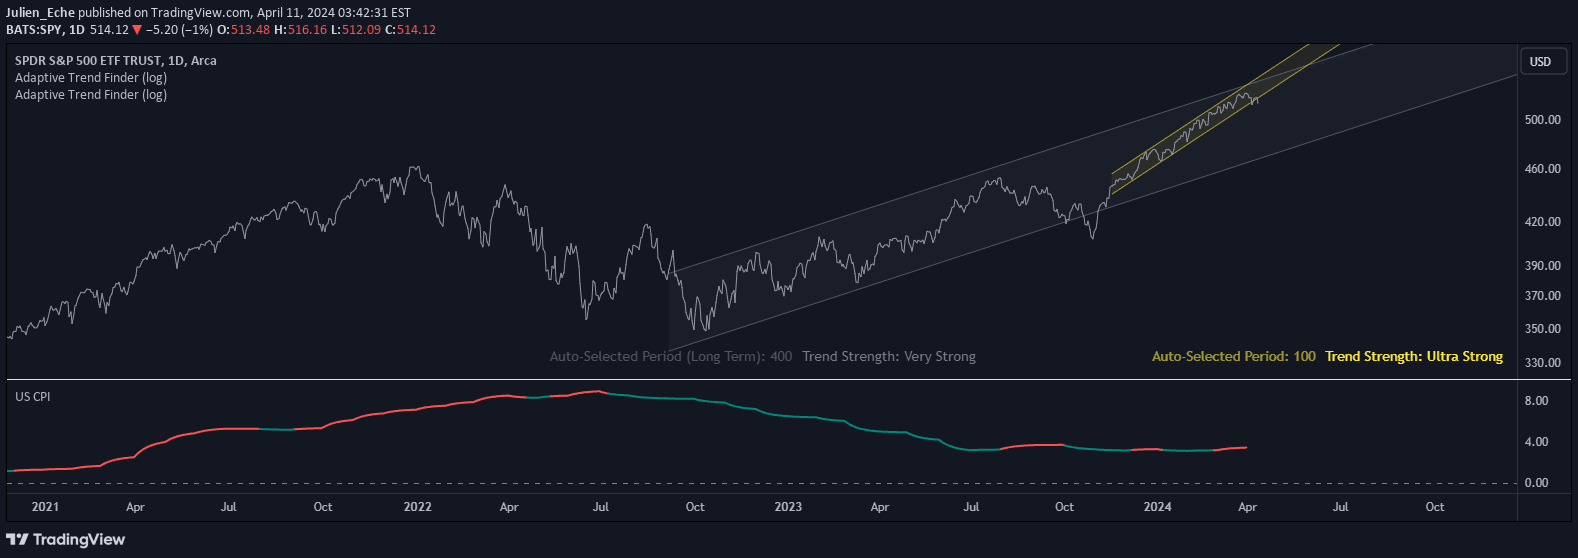
The US CPI indicator tracks inflation rates by analyzing changes in consumer prices, providing crucial economic insights for traders and investors monitoring economic health.
A comprehensive financial indicator that provides traders a quick overview of company performance through key metrics like sector, earnings, growth, and valuation in a chart-based format.
A stock ranking strategy analyzing companies' return on capital and earnings yield to identify potentially undervalued stocks with strong financial performance.
Likes, views, and comments are historical TradingView snapshots. They describe attention, not trading performance.