
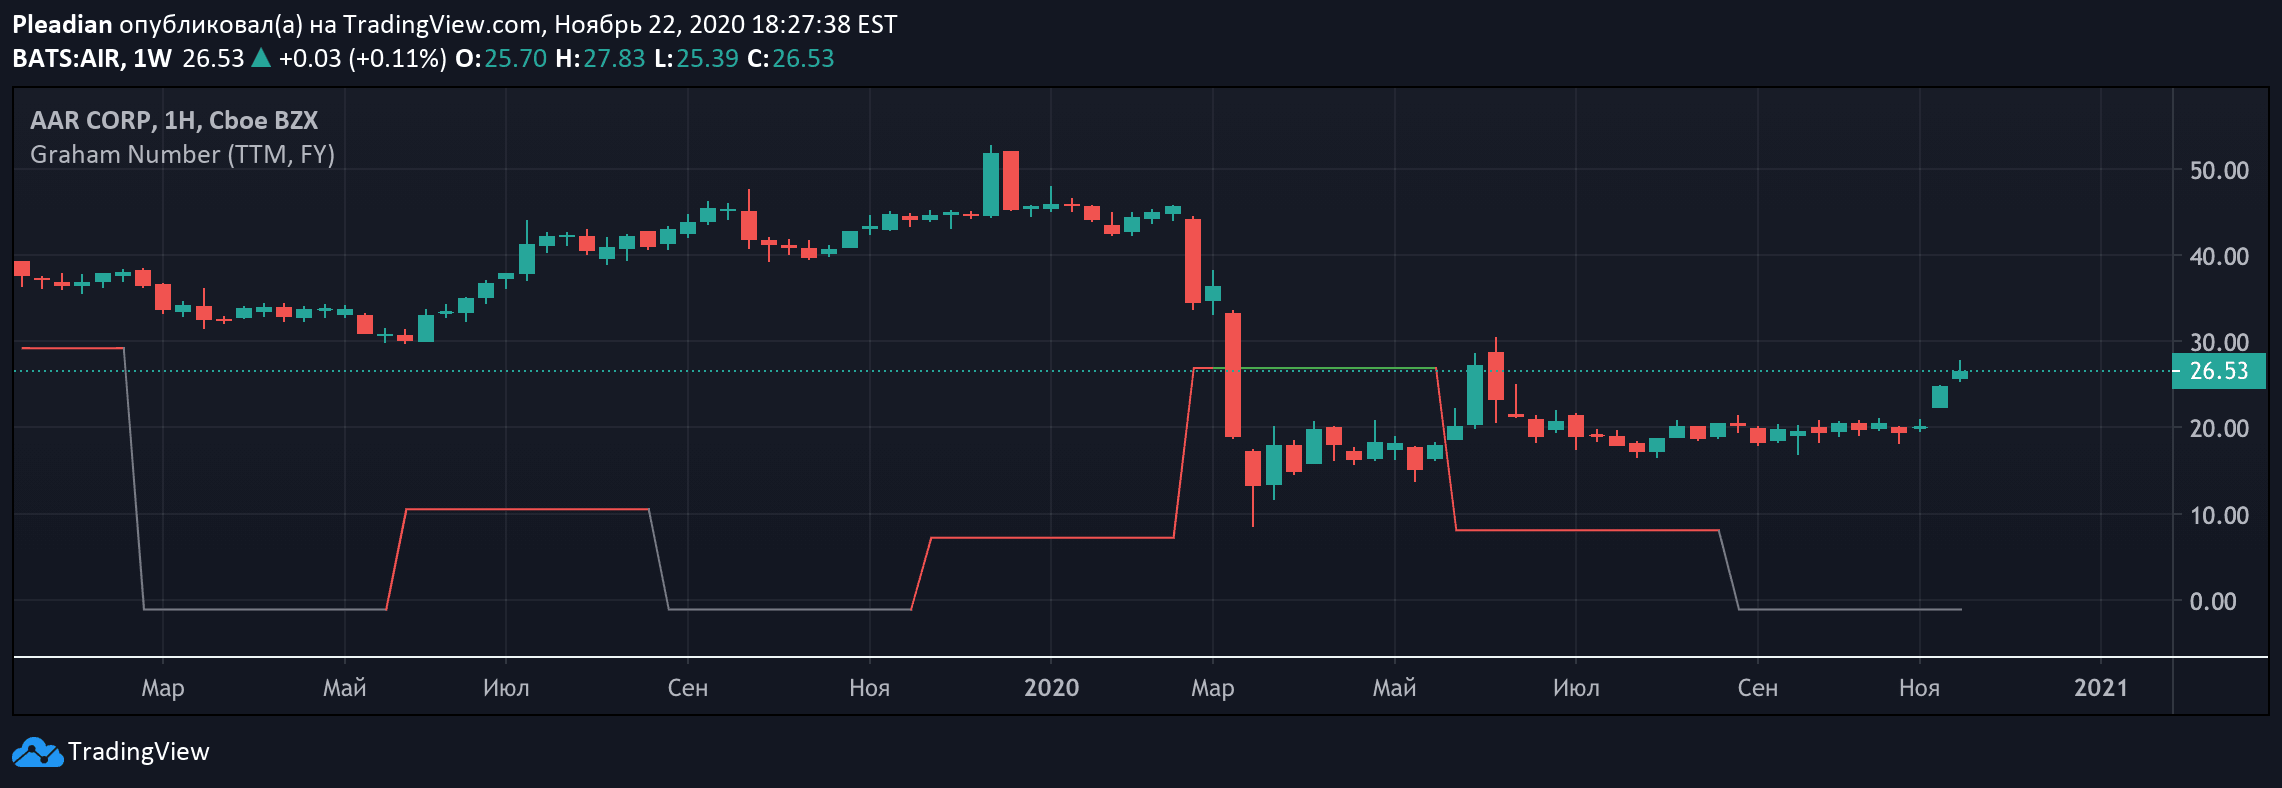
Graham Number is a stock valuation metric that calculates a stock's maximum fair market value by considering earnings per share and book value per share using a specific formula.
Explore complementary indicator rolesHow it works
The Graham Number is calculated by taking the square root of 22.5 multiplied by trailing twelve months earnings per share and most recent quarter book value per share. The 22. 5 factor represents Graham's rule of thumb that a stock's price-to-earnings ratio should not exceed 15 and price-to-book ratio should not exceed 1.5.
By multiplying these ratios, the formula provides a conservative upper limit for a stock's fair market value. The calculation helps investors determine a maximum price they should pay for a stock based on fundamental financial metrics
Why it may be useful
The Graham Number is crucial for value investors seeking to identify undervalued stocks. It provides a systematic approach to evaluating a stock's intrinsic worth by considering key financial fundamentals. By setting a conservative price threshold, investors can avoid overpaying for stocks and minimize potential investment risks.
The metric helps traders and investors make more informed decisions by providing a quantitative benchmark for stock valuation. It encourages a disciplined, analytical approach to investment strategy based on fundamental financial analysis
When to explore it
The Graham Number is most effective when analyzing stable, established companies with consistent earnings and book value. It works best for value investors seeking long-term investments in mature industries with predictable financial performance.
Traders should use this metric alongside other fundamental and technical analysis tools to gain a comprehensive view of a stock's potential. It is particularly useful during market corrections or when seeking defensive investment strategies. The Graham Number can help identify potentially undervalued stocks during periods of market uncertainty
Keep exploring
What we’ve verified
Access, alerts and repainting behaviour have not been independently verified for this indicator. Check the creator’s current publication and settings.
General descriptions and classifications are recovered research. Verified details above identify the specific checks we have completed. Check the creator’s current publication for later changes.


