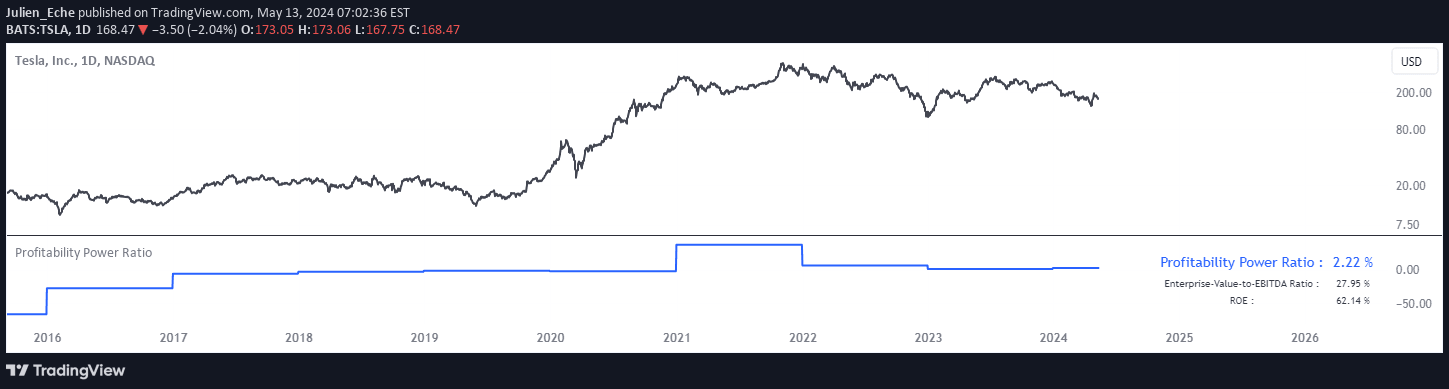
A comprehensive dashboard for evaluating company fundamentals across valuation, profitability, and solvency metrics using dynamic financial analysis and visual scoring.
Explore complementary indicator rolesHow it works
The fundamental analysis dashboard systematically evaluates a company's financial health by calculating and comparing multiple key financial ratios across three primary dimensions: valuation, profitability, and solvency. It uses official financial data to compute metrics like earnings yield, return on invested capital, debt-to-equity, and other critical indicators.
The script leverages Pine Script's request.financial() function to retrieve financial data and dynamically generates color-coded tables that visually represent each metric's performance against predefined thresholds. Users can customize the analysis by selecting annual or quarterly data periods and adjusting evaluation criteria to match their specific investment strategy.
Why it may be useful
Fundamental analysis provides investors with a comprehensive understanding of a company's financial strength and potential investment quality beyond simple price movements. By breaking down complex financial metrics into easily digestible visual representations, the dashboard helps traders quickly assess a company's underlying financial health and potential for long-term growth.
The tool draws inspiration from legendary value investors like Benjamin Graham and Warren Buffett, offering a systematic approach to evaluating businesses. It transforms complex financial data into actionable insights, enabling investors to make more informed decisions based on rigorous financial analysis rather than relying solely on market sentiment or technical indicators.
When to explore it
This fundamental analysis dashboard is most effective for investors seeking a comprehensive, multi-dimensional view of a company's financial performance before making investment decisions. It is particularly valuable for long-term investors, value investors, and those interested in understanding a company's financial fundamentals beyond short-term price fluctuations.
The tool works best when used as part of a broader investment research process, complementing technical analysis and market research. It is especially useful when evaluating potential long-term investments, screening stocks for a portfolio, or comparing the financial health of companies within the same industry or sector.
Keep exploring
What we’ve verified
Access, alerts and repainting behaviour have not been independently verified for this indicator. Check the creator’s current publication and settings.
General descriptions and classifications are recovered research. Verified details above identify the specific checks we have completed. Check the creator’s current publication for later changes.