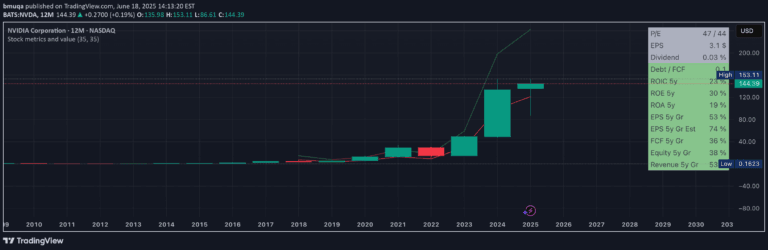
A multi-stock comparative analysis tool that evaluates fundamental performance by comparing year-over-year earnings, sales growth, and P/E ratios across up to 10 stocks simultaneously.
Explore complementary indicator rolesHow it works
The indicator calculates year-over-year earnings and sales growth by comparing the most recent quarterly financial data with the same quarter from the previous year. It determines the percentage change in earnings and sales, providing a direct measure of a company's financial performance trajectory.
Additionally, the indicator computes the price-to-earnings (P/E) ratio, which represents the relationship between a company's stock price and its trailing twelve-month earnings per share. By presenting these metrics side by side, the tool enables traders to conduct a comprehensive fundamental analysis of multiple stocks simultaneously.
Why it may be useful
The comparative fundamental analysis provides traders with a quick and efficient method to assess the relative financial health and performance of multiple stocks. By presenting key metrics like earnings growth, sales growth, and P/E ratio in a single view, traders can rapidly identify which stocks demonstrate superior fundamental characteristics.
This approach helps investors make more informed investment decisions by offering a standardized comparison framework. Instead of manually analyzing each stock's financial statements, traders can quickly spot trends, potential outperformers, and stocks with strong underlying financial momentum.
When to explore it
This indicator is most effective when conducting broad market or sector-wide comparative analyses, particularly during earnings seasons or when evaluating potential investment opportunities. Traders can use it to screen multiple stocks within the same industry, identifying those with the most robust financial performance and attractive valuation metrics.
The tool is particularly valuable for swing traders and long-term investors who prioritize fundamental analysis and seek to understand a company's financial trajectory. It can help filter potential investment candidates by providing a quick, standardized view of financial performance across multiple stocks.
Keep exploring
What we’ve verified
Access, alerts and repainting behaviour have not been independently verified for this indicator. Check the creator’s current publication and settings.
General descriptions and classifications are recovered research. Verified details above identify the specific checks we have completed. Check the creator’s current publication for later changes.