YOUR INDICATOR RESEARCH STARTS HERE

Find the right indicator.
Understand what it does.

Explore 11,183 indicators. Filter beyond the obvious.
Discover the tools that fit the way you trade.

THE INDICATOR LIBRARY

Results for “financials”

11,183 tools to explore

15 indicators matching your filters
Save search
Editor’s pick

Financials on Chart

by TradingView

A comprehensive financial indicator that displays up to 9 fundamental metrics from income statements, balance sheets, cash flow, and financial statistics directly on your trading chart.

Main price chart · unverifiedDay Trading · Swing Trading
Explore
2.4Klikes50.9Kviews49comments

Save
TrendMomentumEditor’s pick

Financials - Comparing Companies

by LonesomeTheBlue

A Pine Script indicator that compares financial metrics across multiple companies in the same sector, providing comprehensive insights into stock performance using key financial ratios and moving averages.

Main price chartSwing Trading
Explore
1.2Klikes33.1Kviews32comments
Save
VolumeTrendEditor’s pick

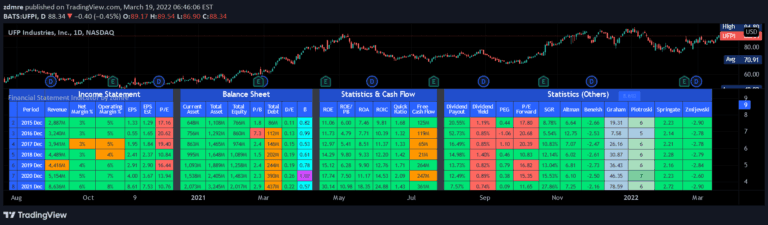
Financial Statement Indicator by zdmre

by zdmre

A comprehensive financial analysis tool that combines key financial statement metrics to assess a company's financial health, performance, and investment potential across income, balance sheet, and cash flow dimensions.

Separate pane · unverifiedSwing Trading
Explore
754likes23.8Kviews28comments
Save
Editor’s pick

Quality Screen

by Trendoscope

A comprehensive financial health assessment that evaluates a company's debt management, liquidity, and profitability through multiple key financial metrics and risk indicators.

Separate pane · unverifiedSwing Trading
Explore
719likes24.2Kviews17comments
Save
TrendEditor’s pick

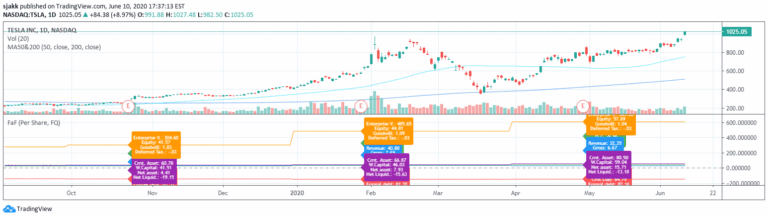
Funamental and financials

by sjakk

A comprehensive financial health indicator that analyzes quarterly reporting data, displaying trends in debt, cash, and earnings through a unique Pine Script approach for comprehensive market analysis.

Separate pane · unverifiedSwing Trading
Explore
610likes13.8Kviews18comments
Save
TrendSignal

Financials - Quick Overview

by furry_nemesis

A comprehensive financial indicator that provides traders a quick overview of company performance through key metrics like sector, earnings, growth, and valuation in a chart-based format.

Main price chart · unverifiedDay Trading · Swing Trading
Explore
135likes2.9Kviews9comments
Save
TrendSignal

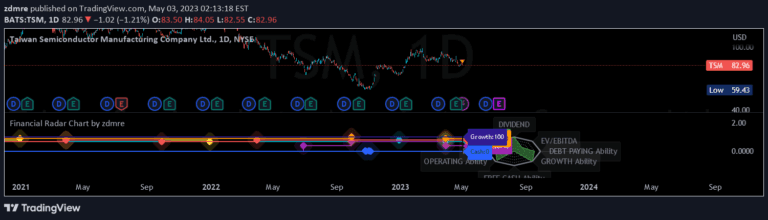
Financial Radar Chart by zdmre

by zdmre

A comprehensive financial analysis radar chart that evaluates multiple key performance indicators to assess a company's financial health and investment potential.

Separate pane · unverifiedSwing Trading
Explore
105likes3.8Kviews12comments
Save
LevelsSignalTrend

PE Ratio Intrinsic Value

by YavuzAkbay

A comparative valuation tool that calculates intrinsic stock value by analyzing PE ratios across multiple stocks, helping investors identify potential undervalued or overvalued opportunities.

Main price chart · unverifiedSwing Trading
Explore
92likes1.9Kviews1comments
Save
LevelsSignal

IOFin F-Score by zdmre

by zdmre

The IOFin F-Score evaluates a company's financial strength by assessing ten key criteria. It provides a discrete score between zero and ten to help investors identify strong value stocks.

Separate pane · unverifiedSwing Trading
Explore
88likes3.1Kviews10comments
Save
TrendSignal

Majors HOD/LOD

by Level8Trading

A technical indicator tracking the simultaneous high or low points of major American market sectors (QQQ, XLF, XLV) to gauge market strength and potential trading direction.

Main price chart · unverifiedScalping · Day Trading
Explore
56likes3.9Kviews0comments
Save

Likes, views, and comments are historical TradingView snapshots. They describe attention, not trading performance.

START WITH A QUESTION

A little less searching.
A lot more understanding.

Tell DeepAlpha what you need. Get an explanation, a shortlist,
and a direct path to the indicators behind it.

Ask DeepAlpha