
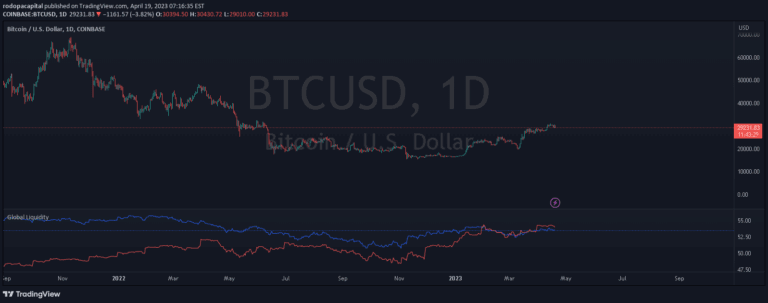
Global Liquidity
Global Liquidity indicator tracks money supply across major economies, plotting regional liquidity values to help traders understand global economic trends and potential investment opportunities.
Explore 11,183 indicators. Filter beyond the obvious.
Discover the tools that fit the way you trade.
11,183 tools to explore
Global Liquidity indicator tracks money supply across major economies, plotting regional liquidity values to help traders understand global economic trends and potential investment opportunities.
Historical Volatility indicator measures price variation over time using standard deviation of returns, helping traders understand market trends and potential risks through volatility analysis.
A predictive indicator measuring market-wide equity allocation by comparing total market value of stocks against bonds and cash, revealing potential long-term market movements.
Real VIX is a volatility indicator that measures market volatility by comparing current VIX to its smoothed version, helping traders anticipate market movements and potential economic shifts.
A technical indicator that calculates year-over-year or month-over-month returns of a security, visually representing price performance through color-coded chart analysis.
A custom indicator that calculates total Bitcoin trading volume across multiple exchanges, plotting volume as a histogram with a Simple Moving Average to analyze market activity.
A comparative financial analysis tool that evaluates a stock's performance against the S&P 500 by analyzing key financial metrics and their relative strengths.
Custom indicator tracking total Ethereum trading volume across multiple exchanges, calculating volume in millions of dollars and plotting a histogram with a Simple Moving Average.
Likes, views, and comments are historical TradingView snapshots. They describe attention, not trading performance.